Group: Airmass; Subgroup: All sky
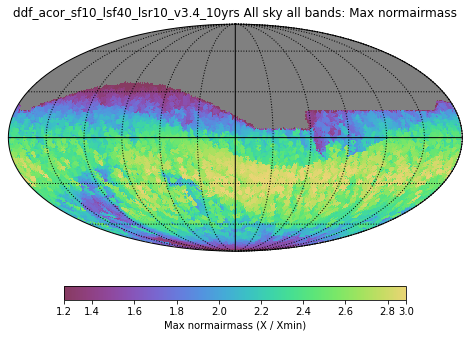
Max airmass
HealpixSlicer
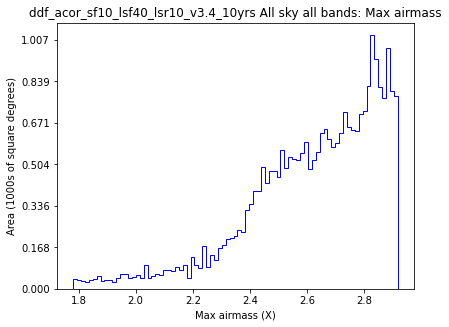
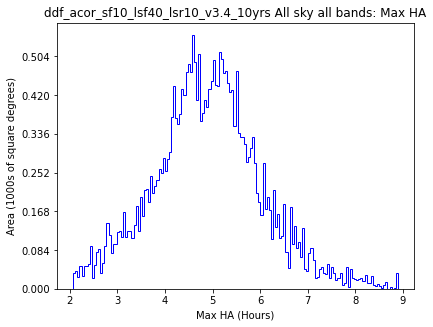
All sky all bands
Map of Max airmass for All sky all bands.
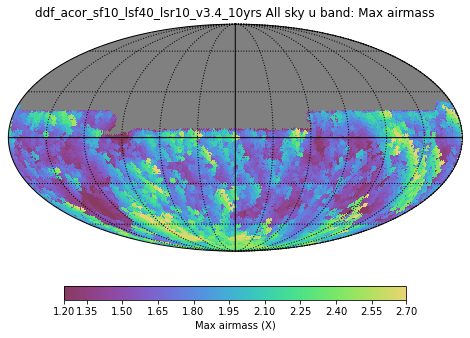
Max airmass
HealpixSlicer
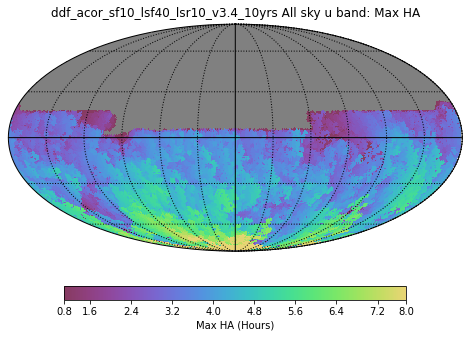
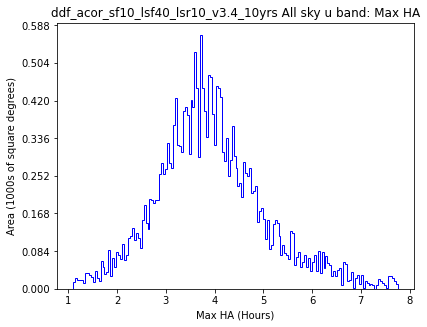
All sky u band
Map of Max airmass for All sky u band.
Max airmass
HealpixSlicer
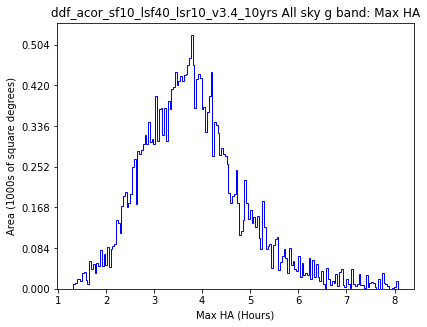
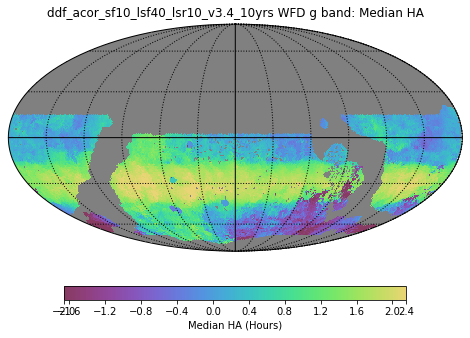
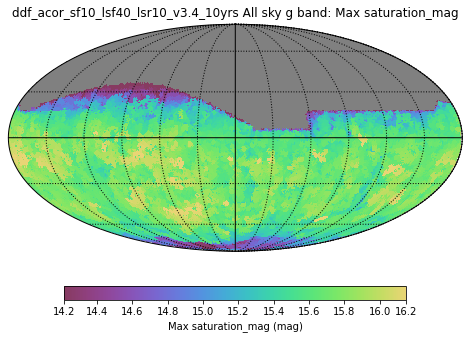
All sky g band
Map of Max airmass for All sky g band.
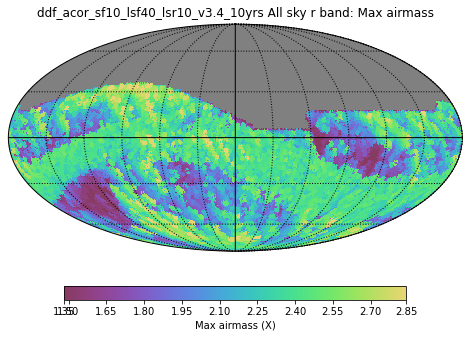
Max airmass
HealpixSlicer
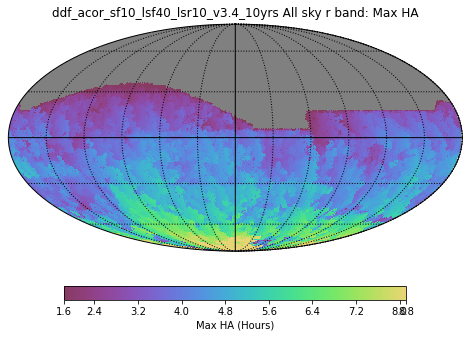
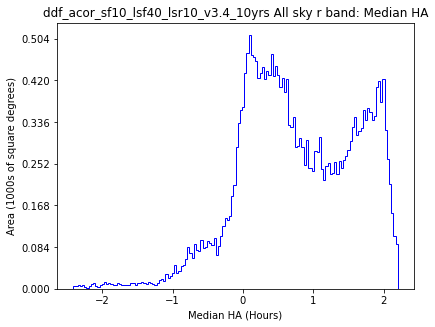
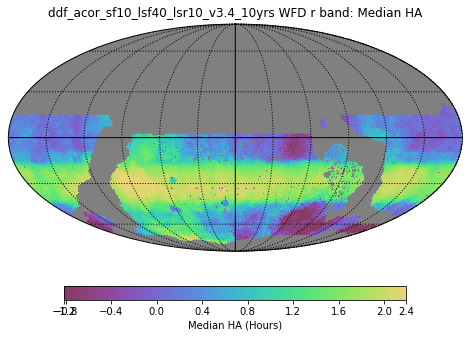
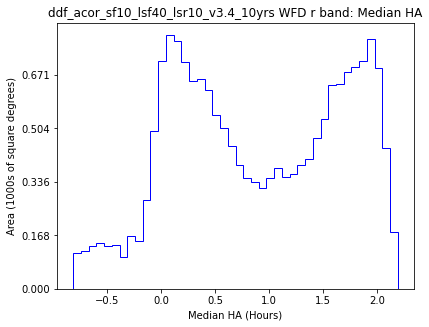
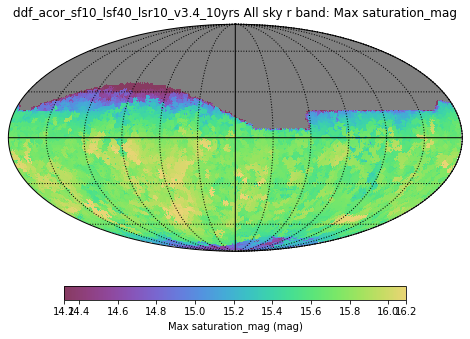
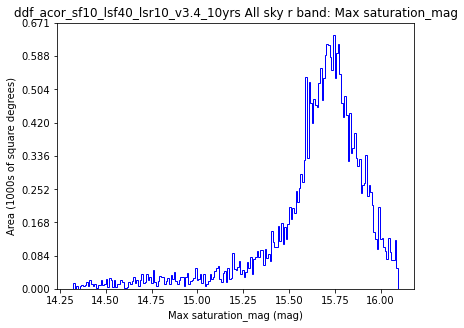
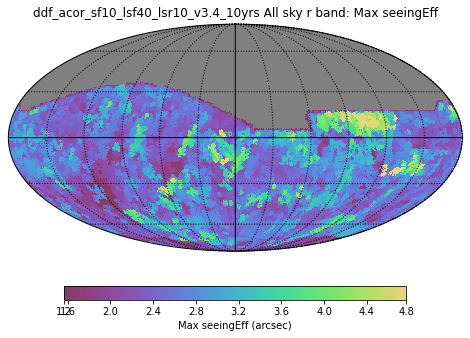
All sky r band
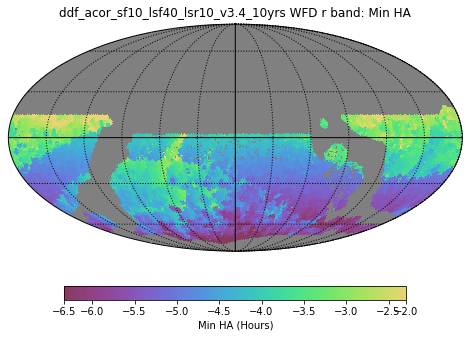
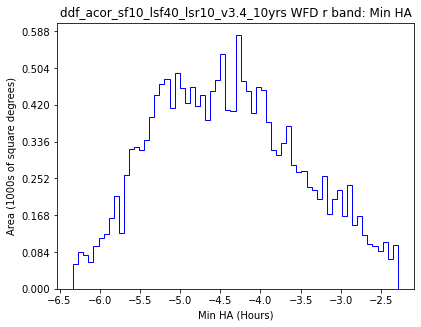
Map of Max airmass for All sky r band.
Max airmass
HealpixSlicer
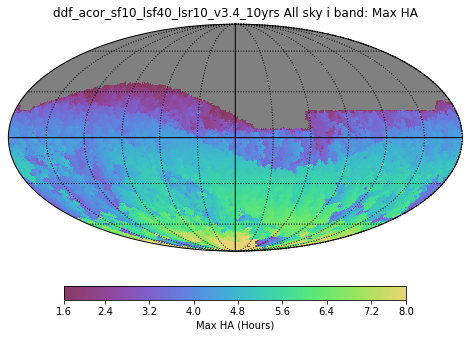
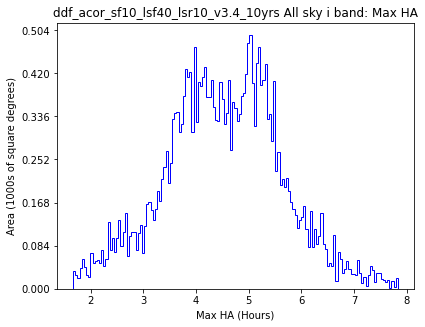
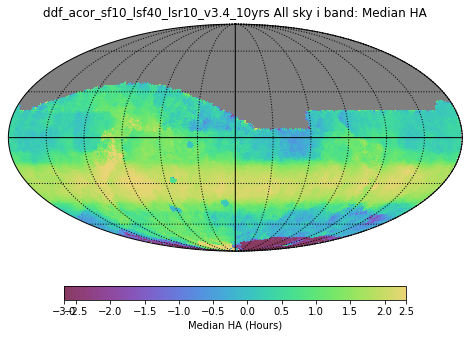
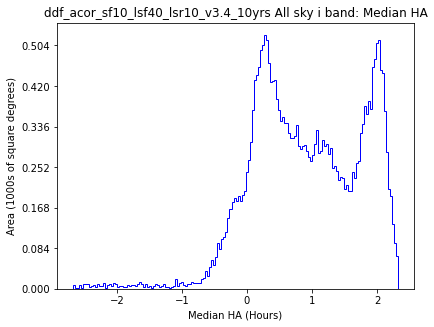
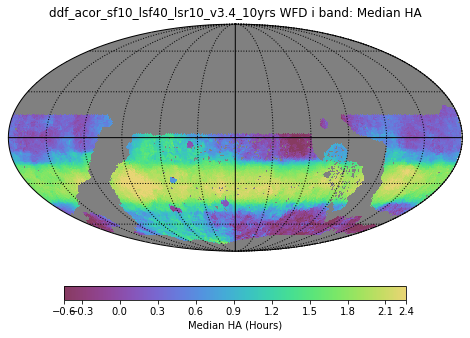
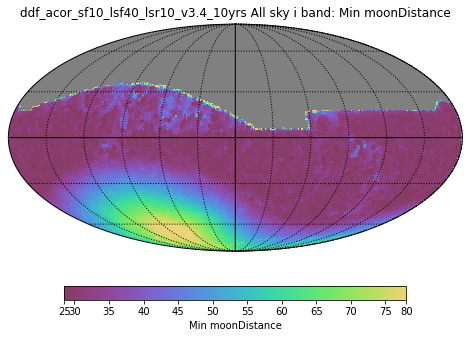
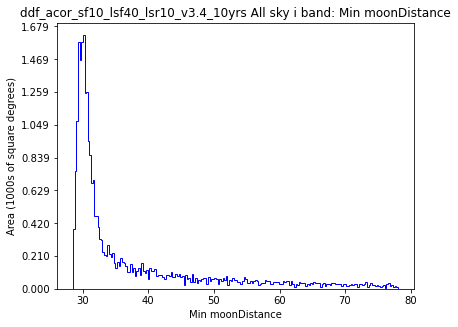
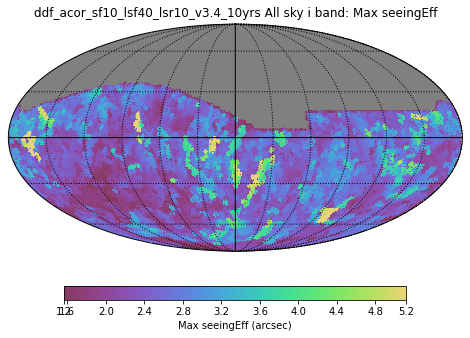
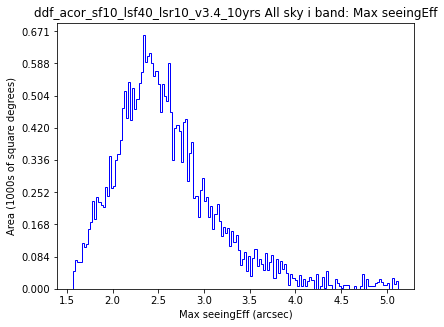
All sky i band
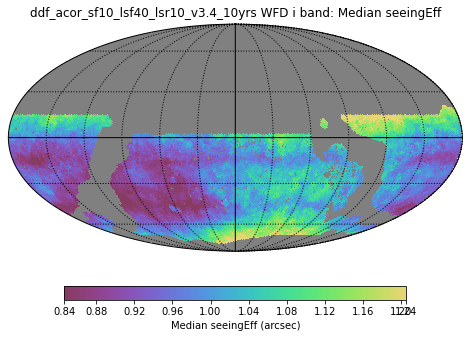
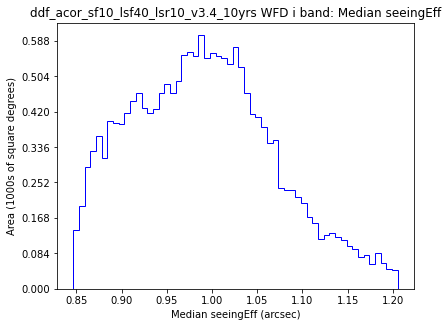
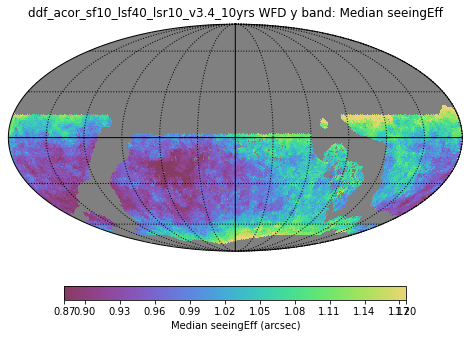
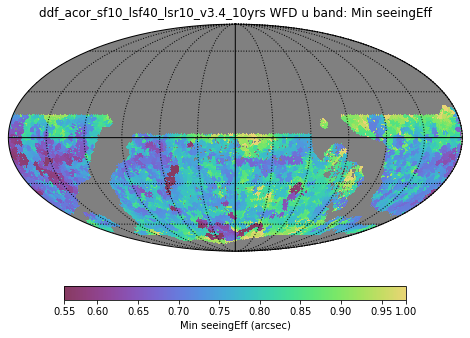
Map of Max airmass for All sky i band.
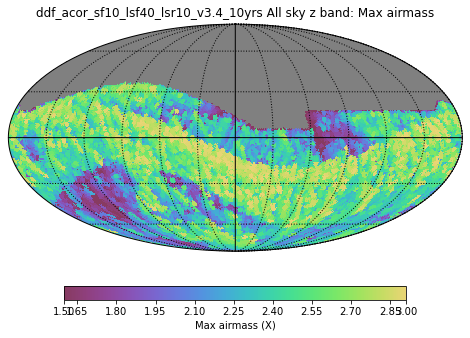
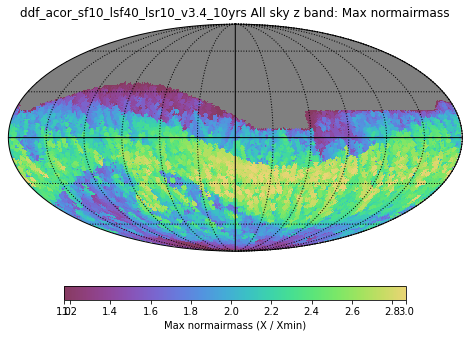
Max airmass
HealpixSlicer
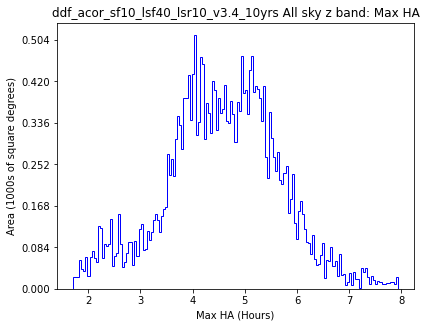
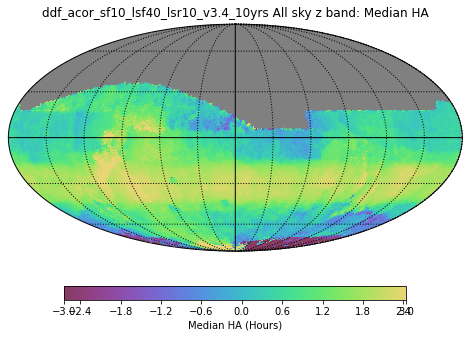
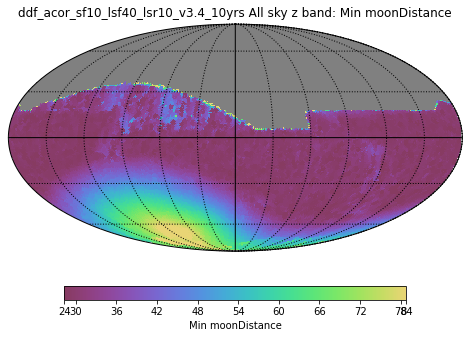
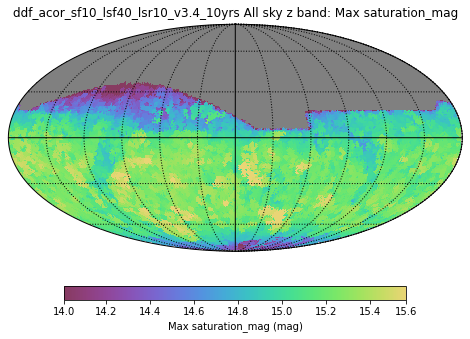
All sky z band
Map of Max airmass for All sky z band.
Max airmass
HealpixSlicer
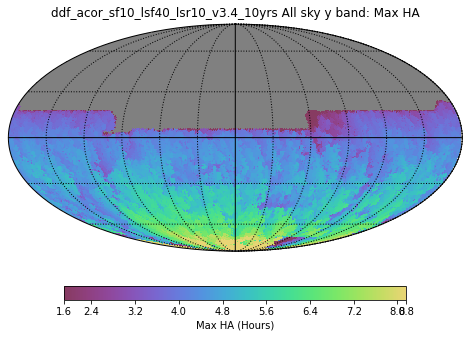
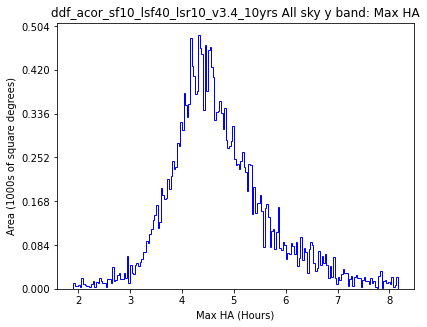
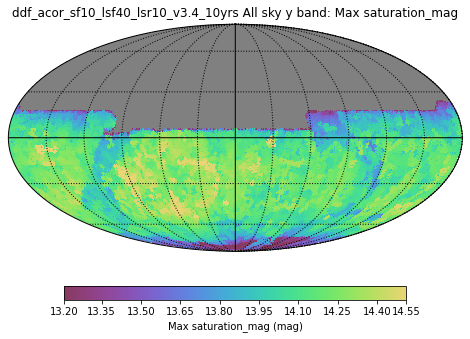
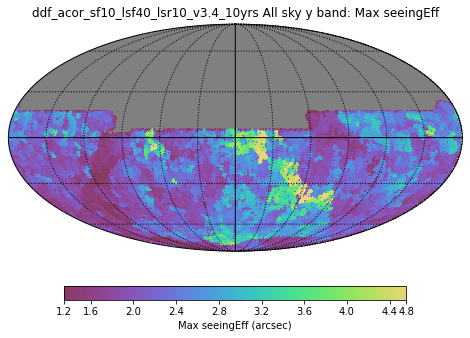
All sky y band
Map of Max airmass for All sky y band.
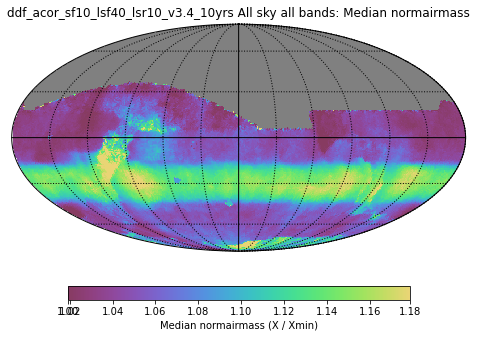
Median airmass
HealpixSlicer
All sky all bands
Map of Median airmass for All sky all bands.
Median airmass
HealpixSlicer
All sky u band
Map of Median airmass for All sky u band.
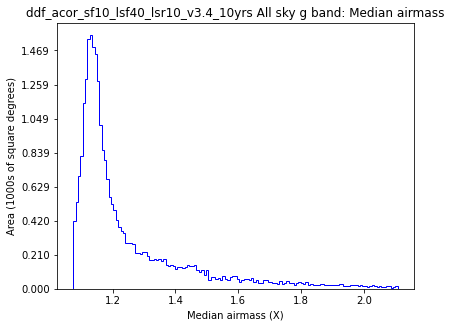
Median airmass
HealpixSlicer
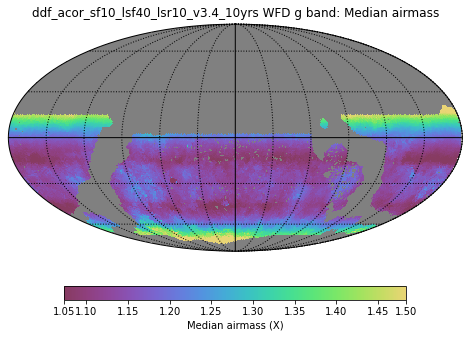
All sky g band
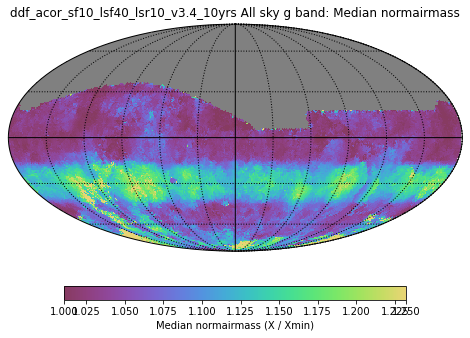
Map of Median airmass for All sky g band.
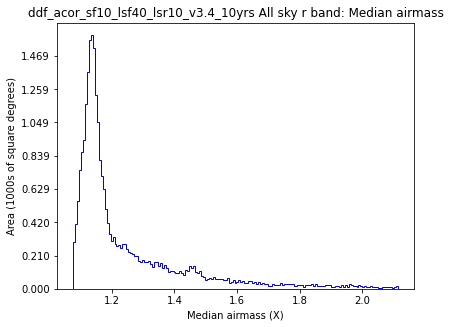
Median airmass
HealpixSlicer
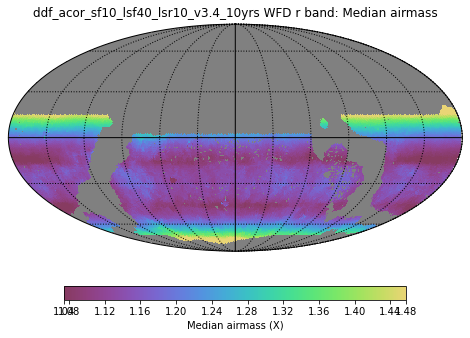
All sky r band
Map of Median airmass for All sky r band.
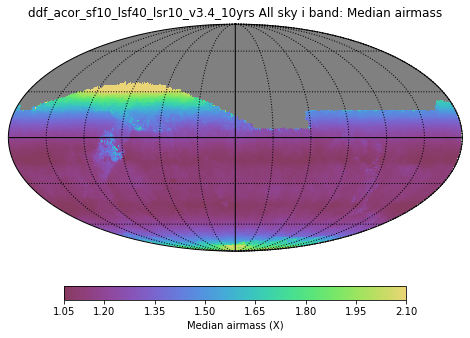
Median airmass
HealpixSlicer
All sky i band
Map of Median airmass for All sky i band.
Median airmass
HealpixSlicer
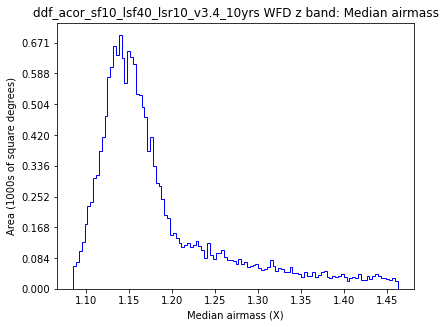
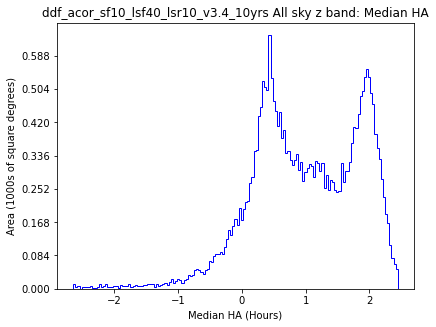
All sky z band
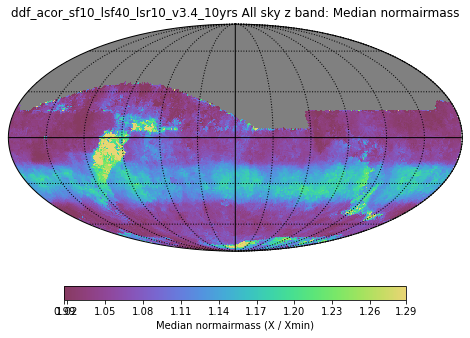
Map of Median airmass for All sky z band.
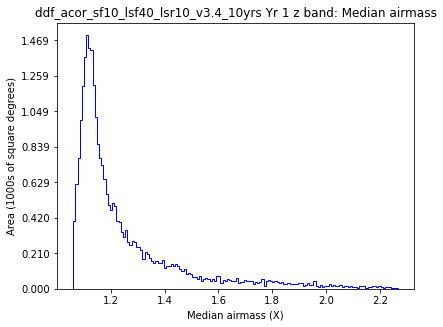
Median airmass
HealpixSlicer
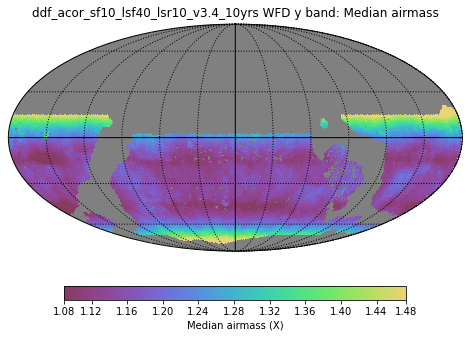
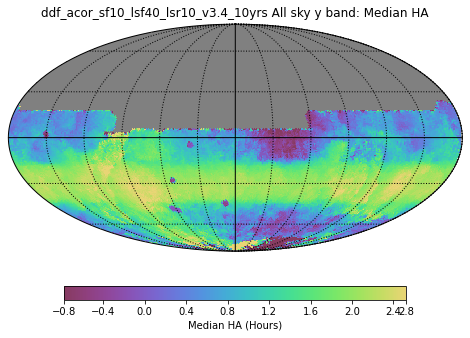
All sky y band
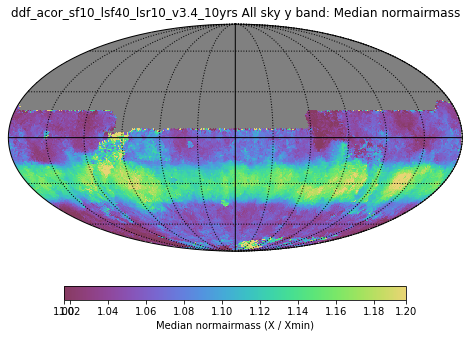
Map of Median airmass for All sky y band.
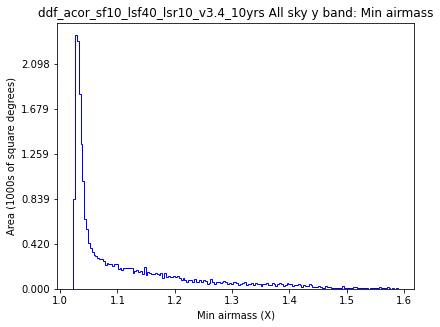
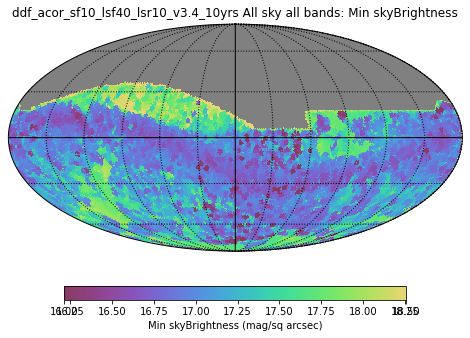
Min airmass
HealpixSlicer
All sky all bands
Map of Min airmass for All sky all bands.
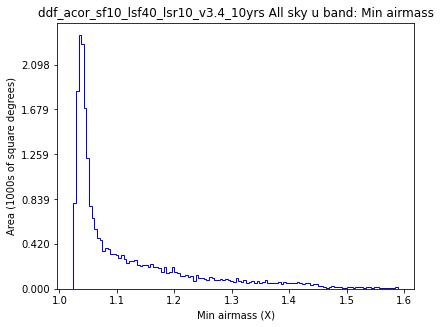
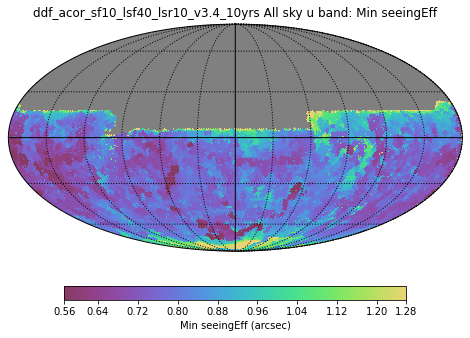
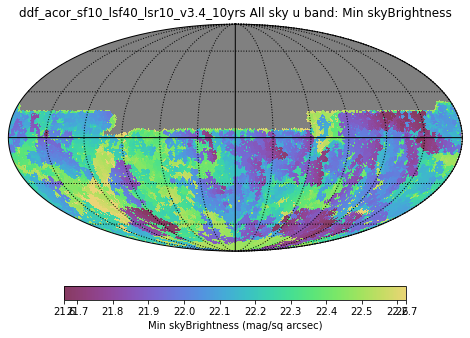
Min airmass
HealpixSlicer
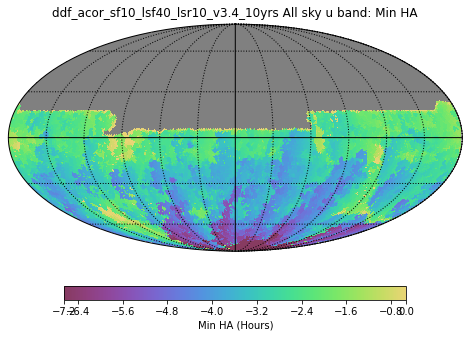
All sky u band
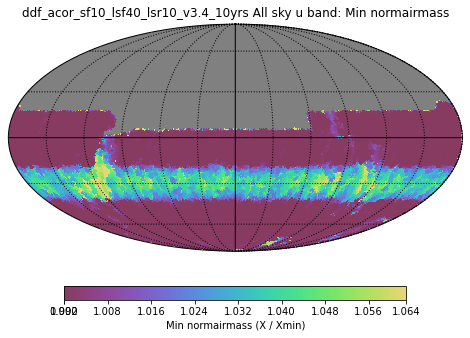
Map of Min airmass for All sky u band.
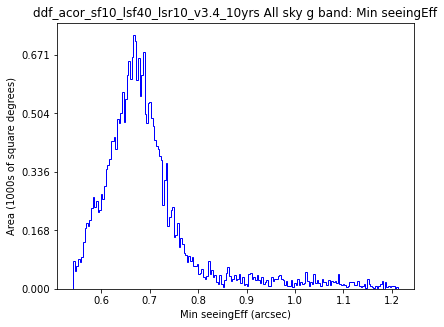
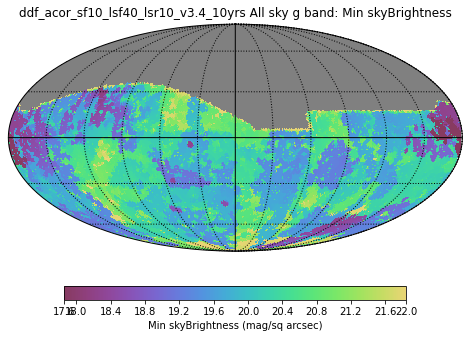
Min airmass
HealpixSlicer
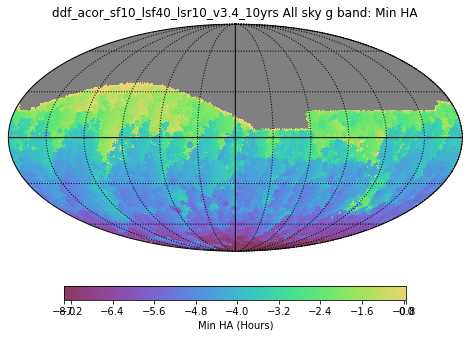
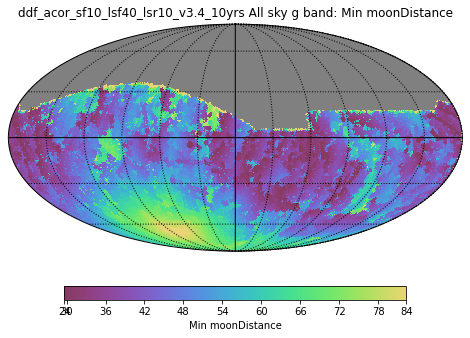
All sky g band
Map of Min airmass for All sky g band.
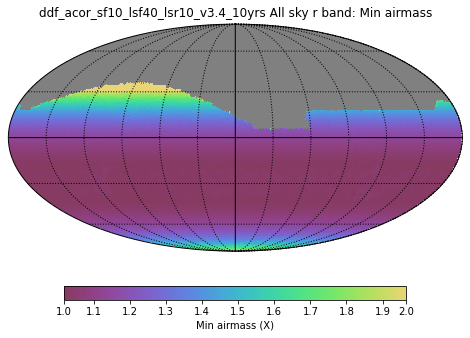
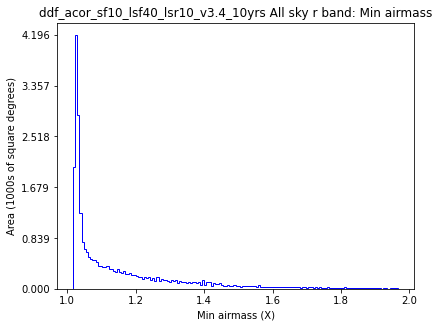
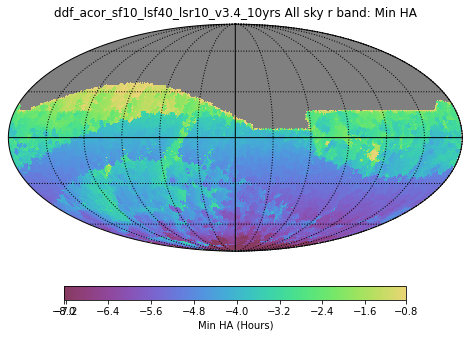
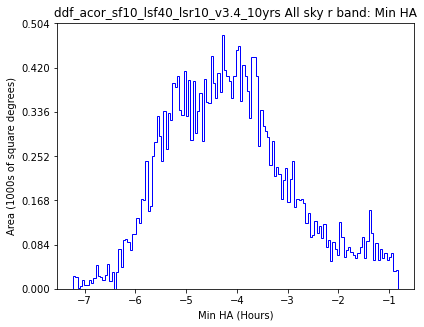
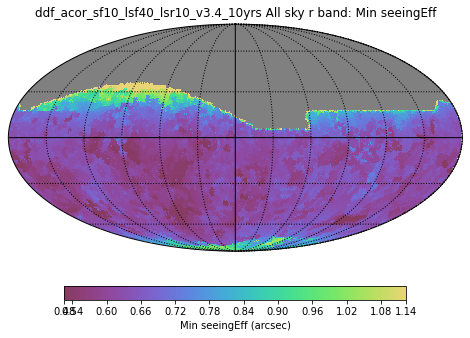
Min airmass
HealpixSlicer
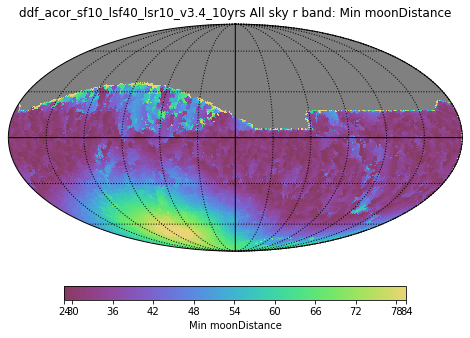
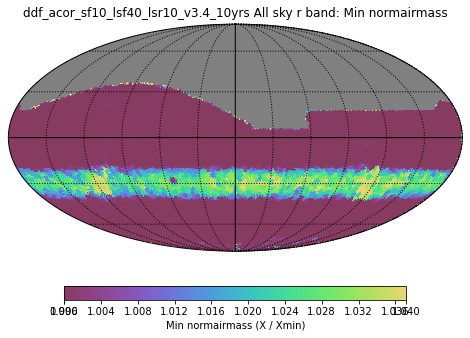
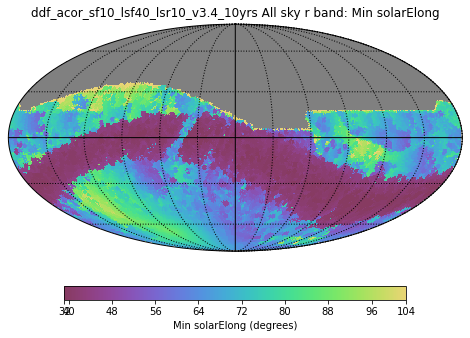
All sky r band
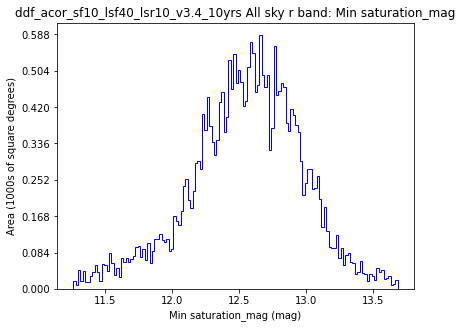
Map of Min airmass for All sky r band.
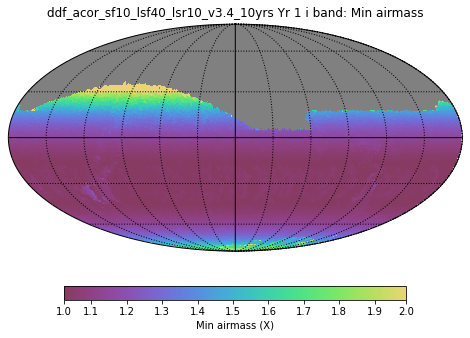
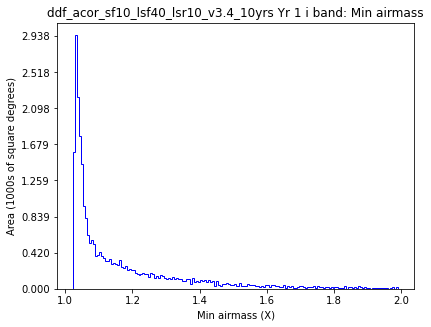
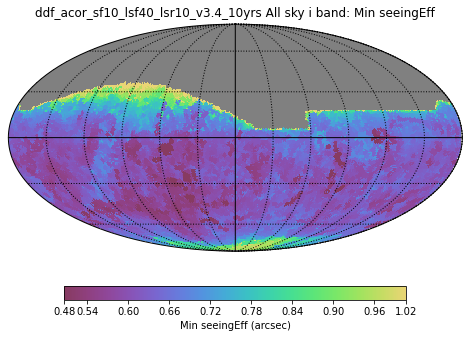
Min airmass
HealpixSlicer
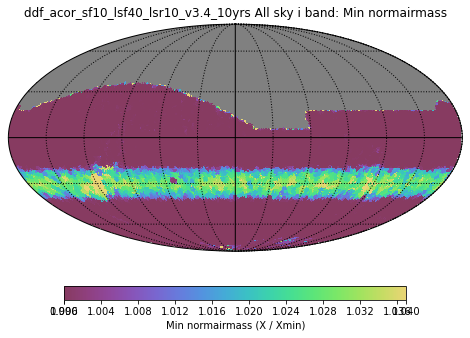
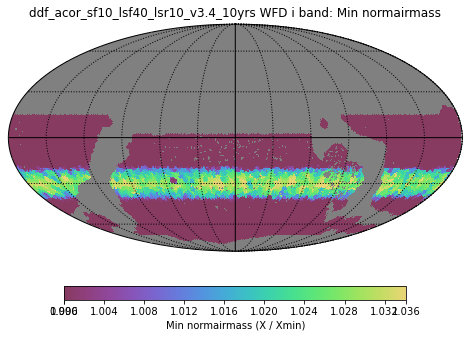
All sky i band
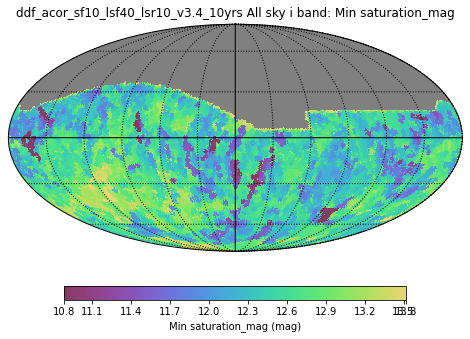
Map of Min airmass for All sky i band.
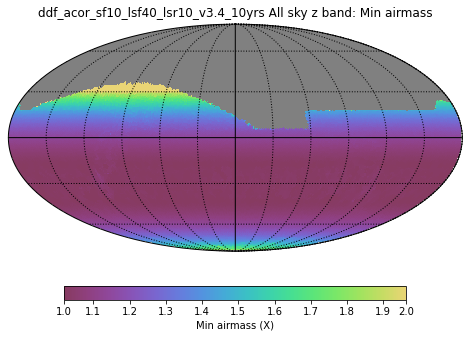
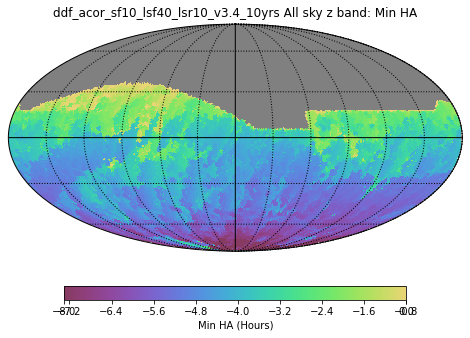
Min airmass
HealpixSlicer
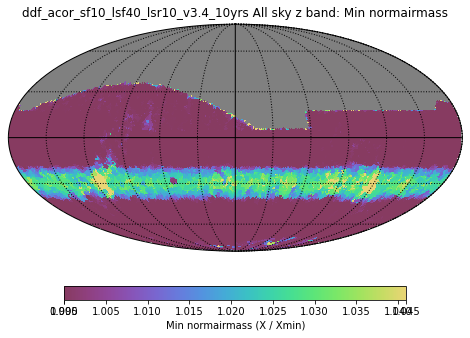
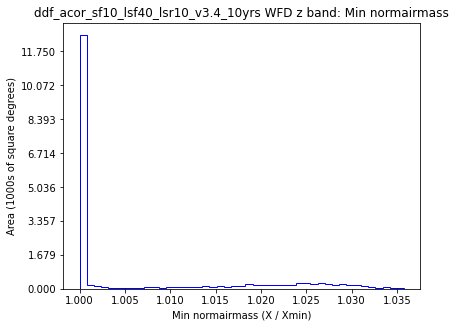
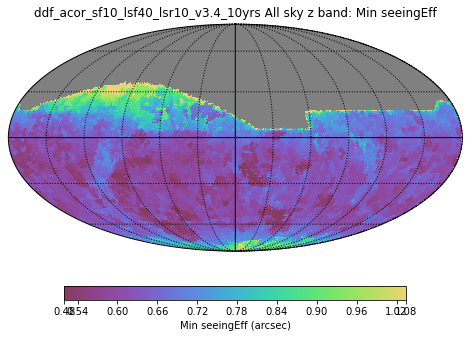
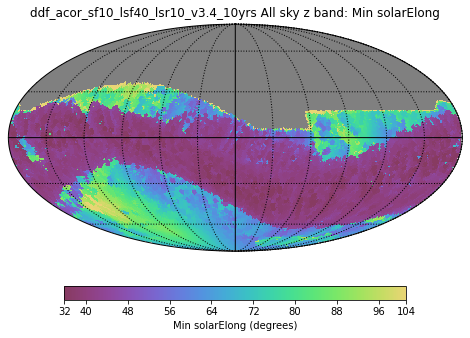
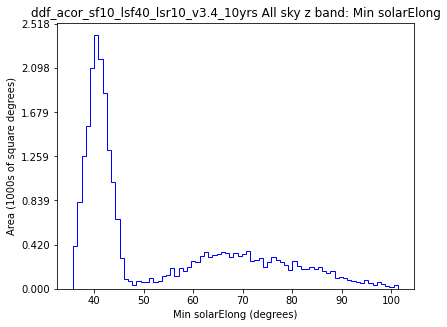
All sky z band
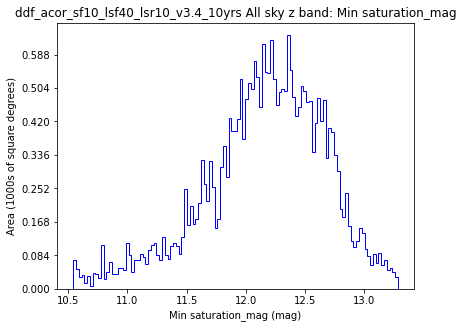
Map of Min airmass for All sky z band.
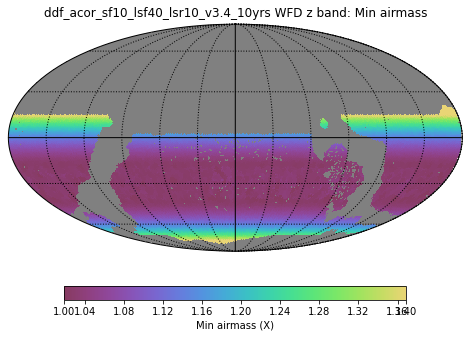
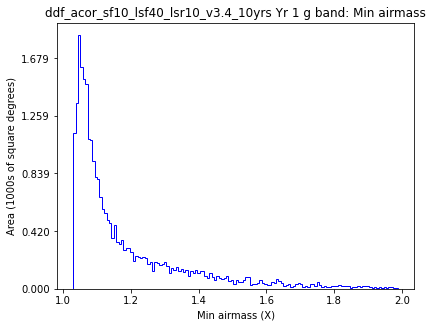
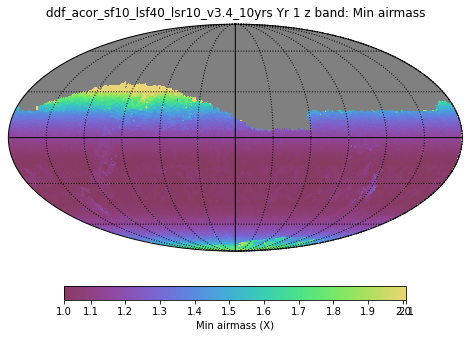
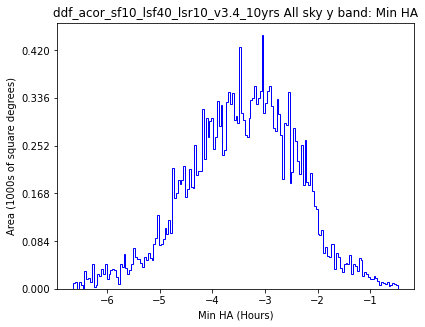
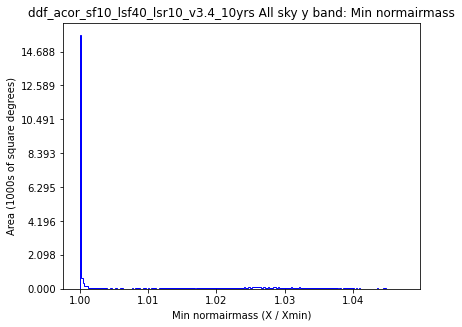
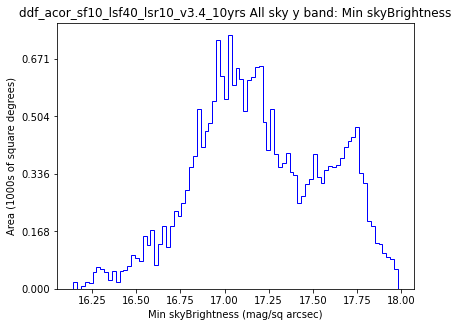
Min airmass
HealpixSlicer
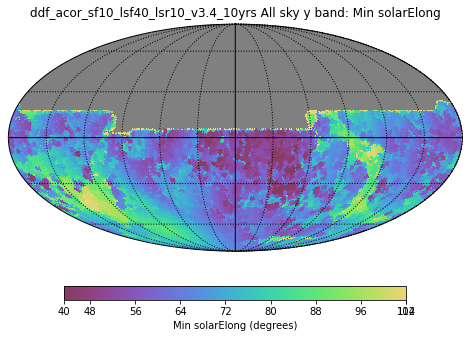
All sky y band
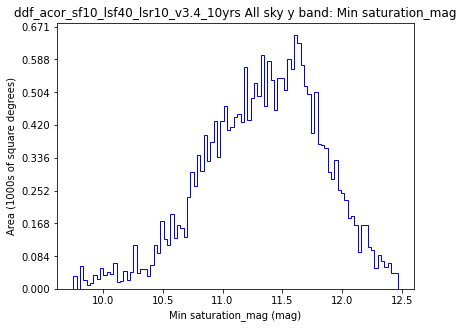
Map of Min airmass for All sky y band.
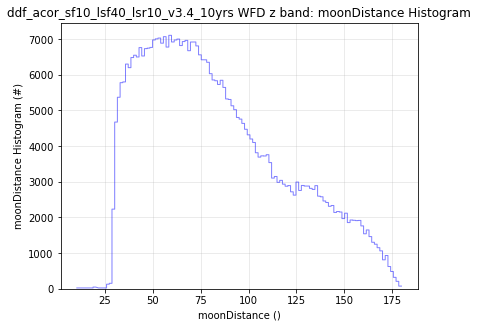
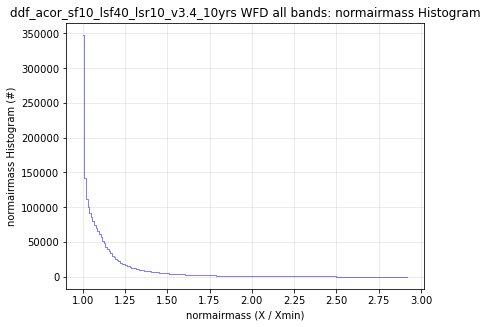
airmass Histogram
OneDSlicer
All sky all bands
Histogram of airmass for All sky all bands.
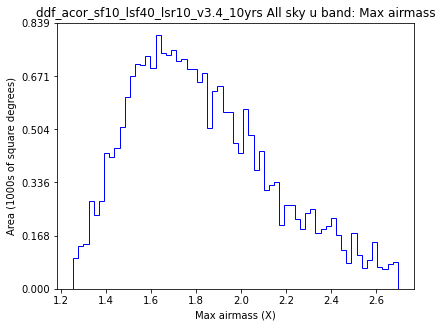
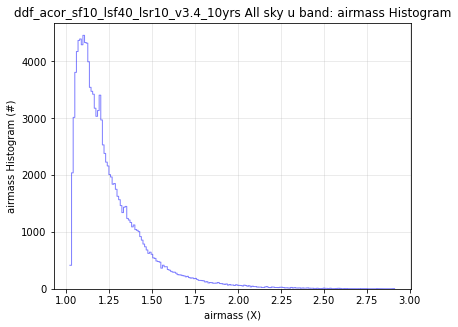
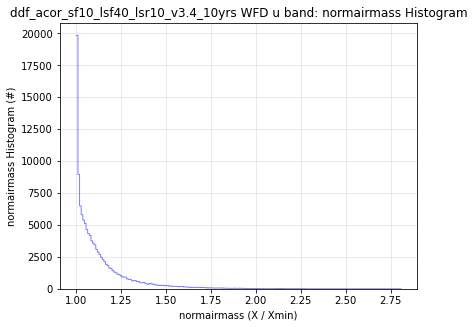
airmass Histogram
OneDSlicer
All sky u band
Histogram of airmass for All sky u band.
airmass Histogram
OneDSlicer
All sky g band
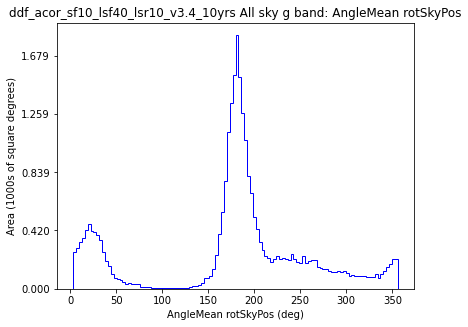
Histogram of airmass for All sky g band.
airmass Histogram
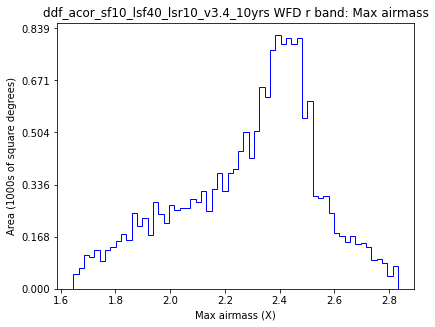
OneDSlicer
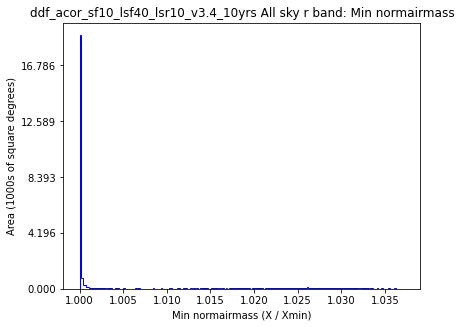
All sky r band
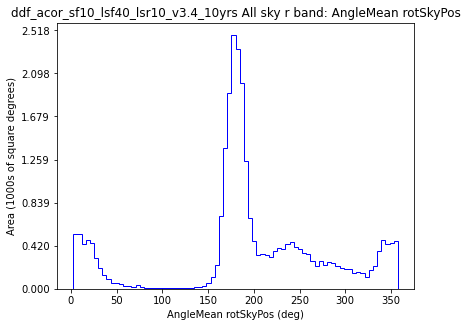
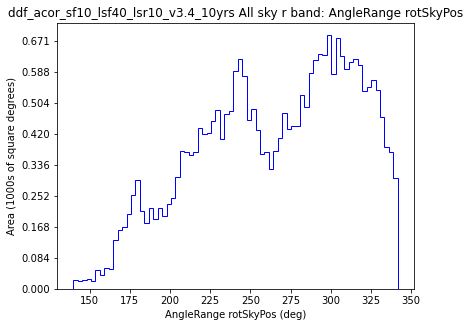
Histogram of airmass for All sky r band.
airmass Histogram
OneDSlicer
All sky i band
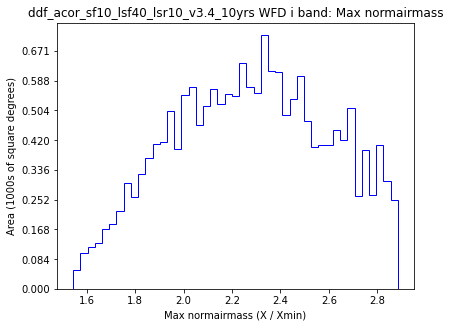
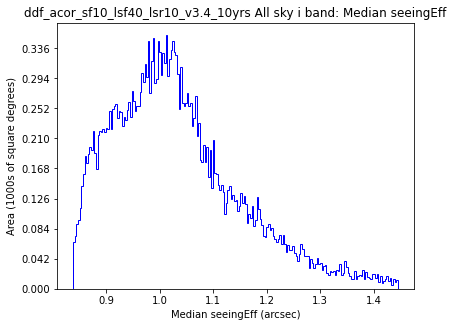
Histogram of airmass for All sky i band.
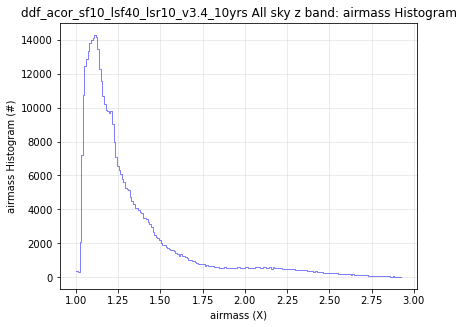
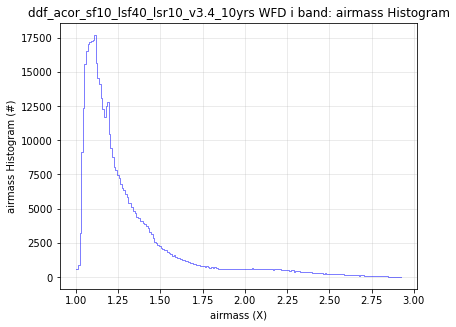
airmass Histogram
OneDSlicer
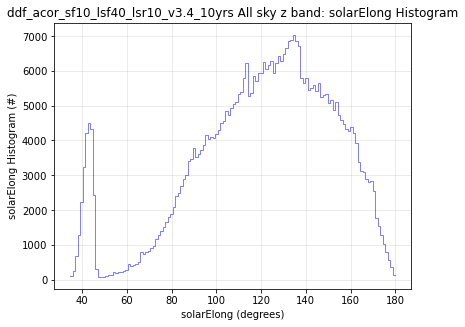
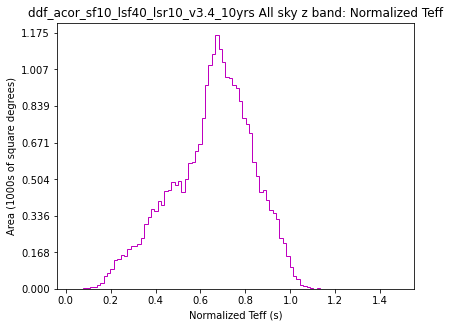
All sky z band
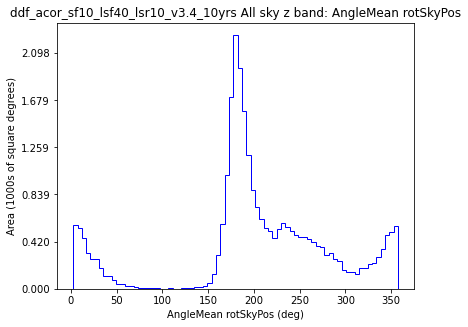
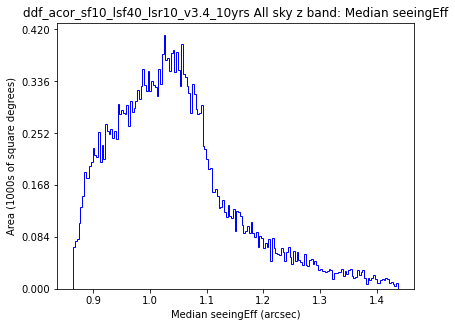
Histogram of airmass for All sky z band.
airmass Histogram
OneDSlicer
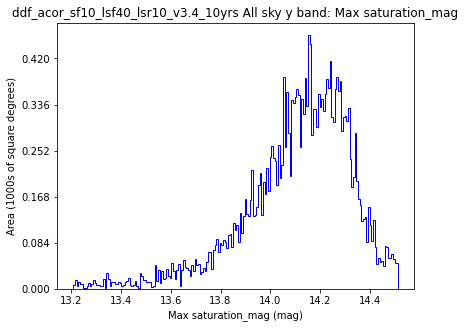
All sky y band
Histogram of airmass for All sky y band.
|
Group: Airmass; Subgroup: All sky; Slicer: HealpixSlicer
|
| Metric Name |
Info Label |
Median |
Mean |
Rms |
N(-3Sigma) |
N(+3Sigma) |
Count |
Min |
Max |
| Max airmass |
All sky all bands |
2.66
|
2.61
|
0.25
|
583
|
0
|
33578
|
1.22
|
2.92
|
| Median airmass |
All sky all bands |
1.16
|
1.26
|
0.21
|
0
|
910
|
33578
|
1.06
|
2.68
|
| Min airmass |
All sky all bands |
1.08
|
1.16
|
0.20
|
0
|
786
|
33578
|
1.00
|
2.56
|
| Max airmass |
All sky u band |
1.78
|
1.83
|
0.33
|
0
|
88
|
29864
|
1.11
|
2.91
|
| Median airmass |
All sky u band |
1.16
|
1.21
|
0.14
|
0
|
610
|
29864
|
1.03
|
2.25
|
| Min airmass |
All sky u band |
1.07
|
1.12
|
0.13
|
0
|
562
|
29864
|
1.02
|
2.01
|
| Max airmass |
All sky g band |
1.98
|
1.99
|
0.28
|
1
|
96
|
33481
|
1.15
|
2.91
|
| Median airmass |
All sky g band |
1.17
|
1.26
|
0.22
|
0
|
892
|
33481
|
1.05
|
2.56
|
| Min airmass |
All sky g band |
1.08
|
1.17
|
0.20
|
0
|
802
|
33481
|
1.00
|
2.56
|
| Max airmass |
All sky r band |
2.34
|
2.26
|
0.30
|
28
|
0
|
33540
|
1.22
|
2.92
|
| Median airmass |
All sky r band |
1.16
|
1.25
|
0.22
|
0
|
907
|
33540
|
1.06
|
2.84
|
| Min airmass |
All sky r band |
1.08
|
1.16
|
0.20
|
0
|
800
|
33540
|
1.00
|
2.84
|
| Max airmass |
All sky i band |
2.44
|
2.42
|
0.33
|
54
|
0
|
33538
|
1.22
|
2.92
|
| Median airmass |
All sky i band |
1.16
|
1.26
|
0.21
|
0
|
902
|
33538
|
1.05
|
2.64
|
| Min airmass |
All sky i band |
1.08
|
1.16
|
0.20
|
0
|
790
|
33538
|
1.00
|
2.64
|
| Max airmass |
All sky z band |
2.47
|
2.44
|
0.32
|
62
|
0
|
33510
|
1.21
|
2.92
|
| Median airmass |
All sky z band |
1.18
|
1.27
|
0.22
|
0
|
839
|
33510
|
1.06
|
2.75
|
| Min airmass |
All sky z band |
1.08
|
1.16
|
0.20
|
0
|
782
|
33510
|
1.00
|
2.73
|
| Max airmass |
All sky y band |
2.30
|
2.26
|
0.33
|
11
|
0
|
29952
|
1.21
|
2.92
|
| Median airmass |
All sky y band |
1.17
|
1.22
|
0.13
|
0
|
623
|
29952
|
1.06
|
2.45
|
| Min airmass |
All sky y band |
1.06
|
1.12
|
0.13
|
0
|
539
|
29952
|
1.00
|
2.45
|
|
Group: Airmass; Subgroup: All sky; Slicer: UniSlicer
|
| |
25th%ile airmass |
75th%ile airmass |
Count airmass |
Max airmass |
Mean airmass |
Median airmass |
Min airmass |
N(+3Sigma) airmass |
N(-3Sigma) airmass |
Rms airmass |
| All sky all bands |
1.11
|
1.37
|
2147095
|
2.92
|
1.30
|
1.20
|
1.00
|
60096
|
0
|
0.29
|
| All sky g band |
1.11
|
1.39
|
196987
|
2.91
|
1.29
|
1.20
|
1.00
|
3883
|
0
|
0.26
|
| All sky i band |
1.11
|
1.37
|
500895
|
2.92
|
1.31
|
1.19
|
1.00
|
14246
|
0
|
0.32
|
| All sky r band |
1.11
|
1.36
|
489465
|
2.92
|
1.29
|
1.19
|
1.00
|
14398
|
0
|
0.28
|
| All sky u band |
1.11
|
1.33
|
124477
|
2.91
|
1.25
|
1.19
|
1.02
|
2543
|
0
|
0.21
|
| All sky y band |
1.12
|
1.35
|
394073
|
2.92
|
1.28
|
1.20
|
1.00
|
9009
|
0
|
0.24
|
| All sky z band |
1.11
|
1.40
|
441198
|
2.92
|
1.33
|
1.21
|
1.00
|
12092
|
0
|
0.33
|
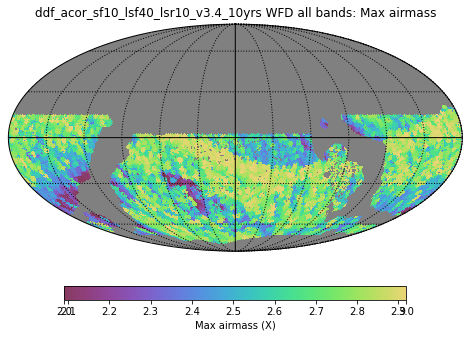
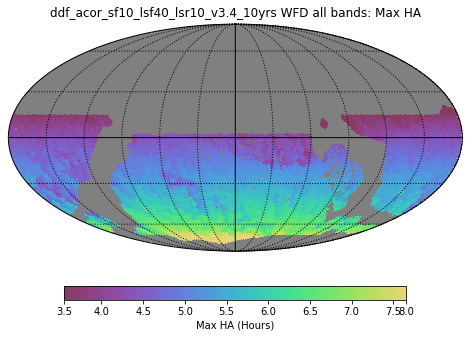
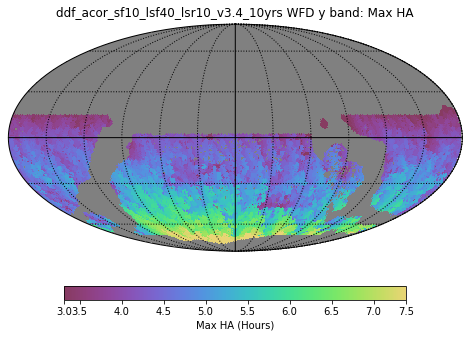
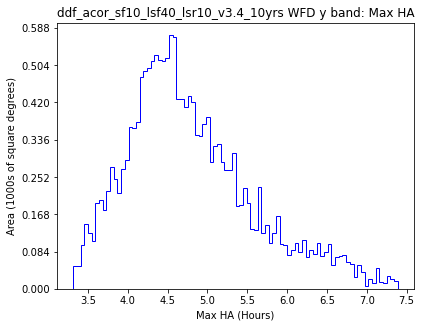
Group: Airmass; Subgroup: WFD
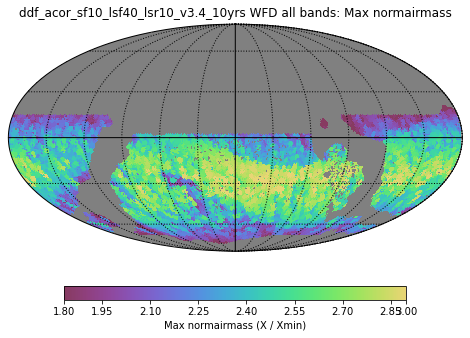
Max airmass
HealpixSubsetSlicer
WFD all bands
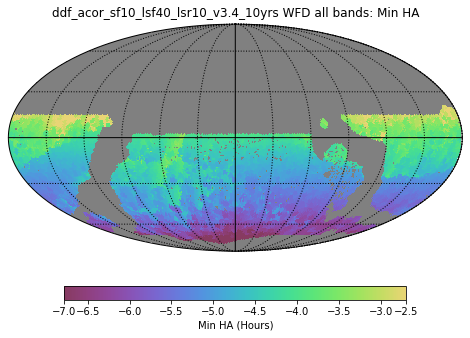
Map of Max airmass for WFD all bands.
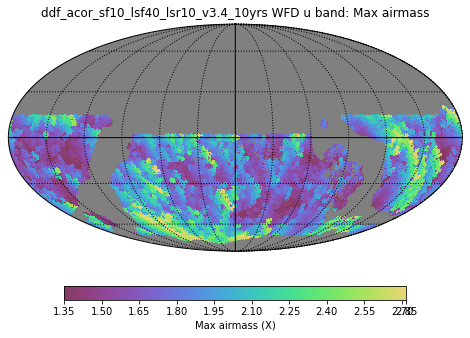
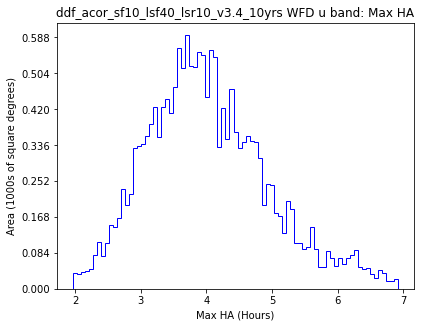
Max airmass
HealpixSubsetSlicer
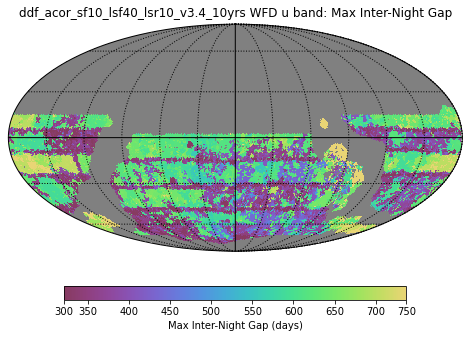
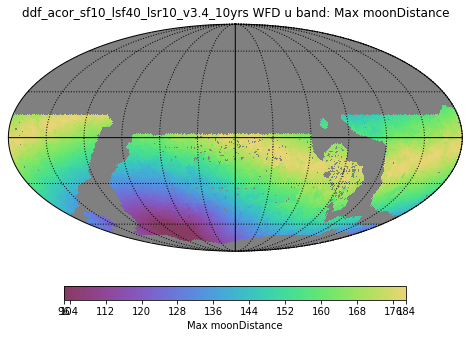
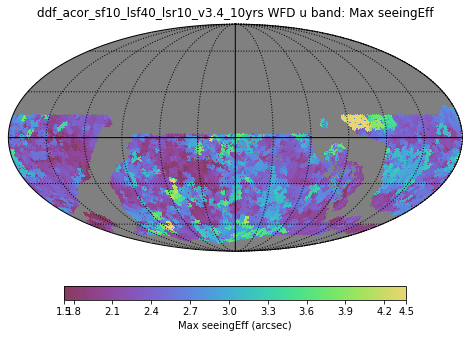
WFD u band
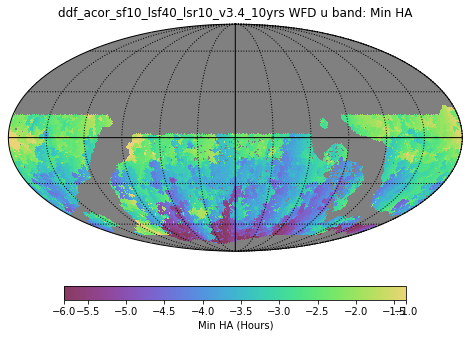
Map of Max airmass for WFD u band.
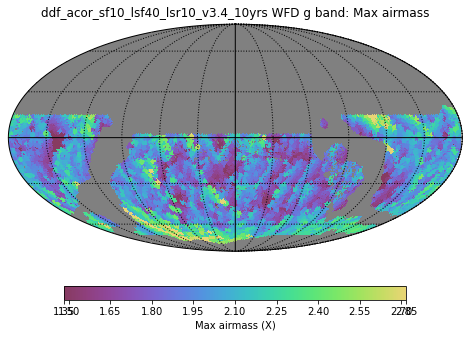
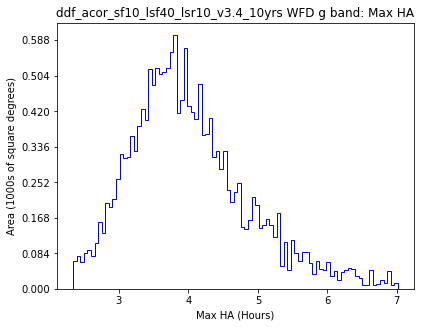
Max airmass
HealpixSubsetSlicer
WFD g band
Map of Max airmass for WFD g band.
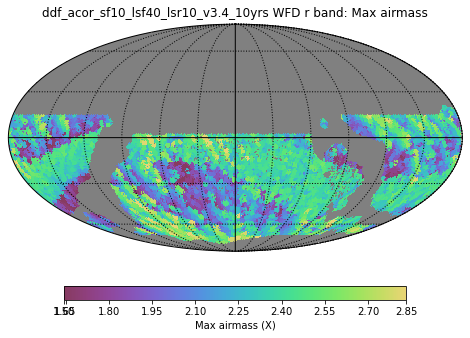
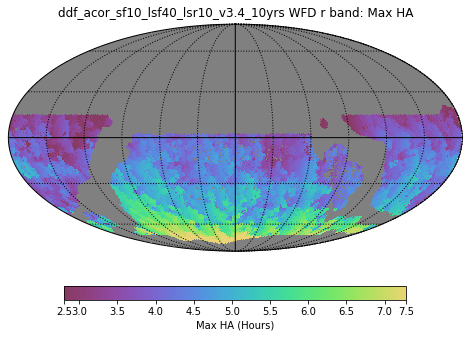
Max airmass
HealpixSubsetSlicer
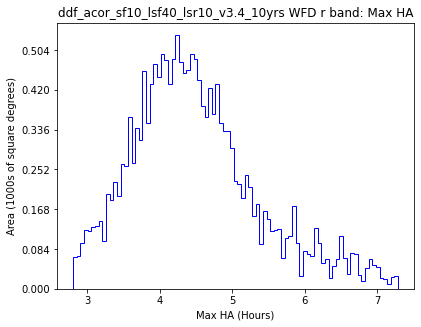
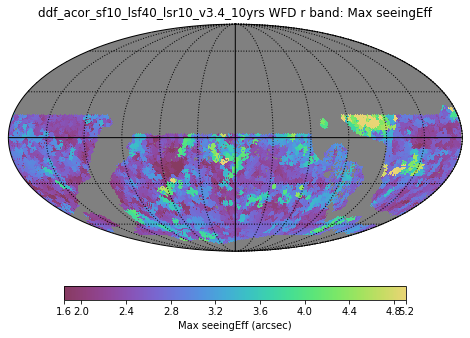
WFD r band
Map of Max airmass for WFD r band.
Max airmass
HealpixSubsetSlicer
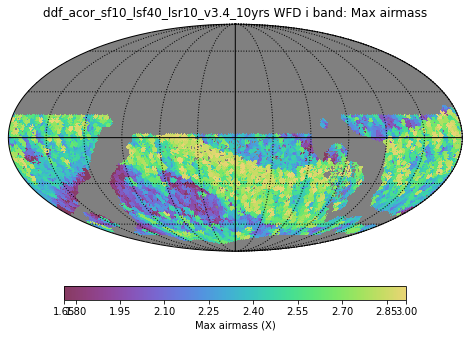
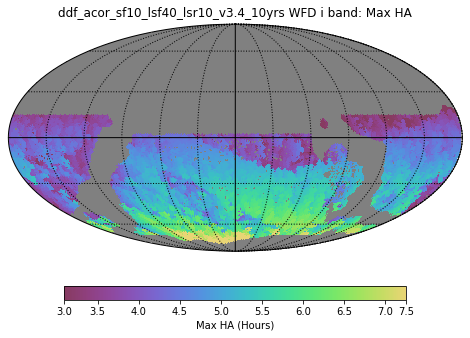
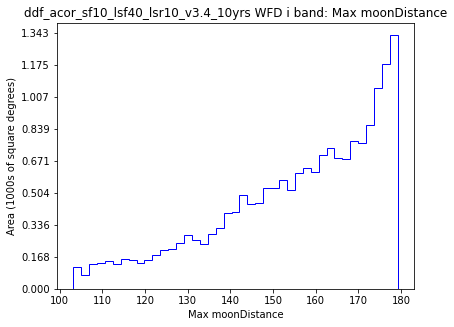
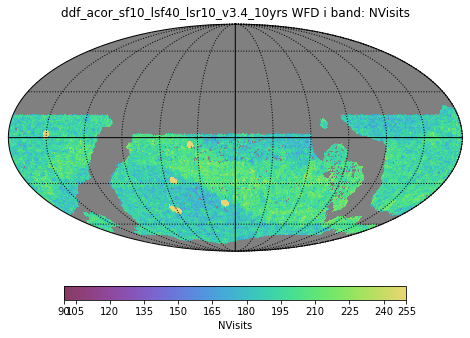
WFD i band
Map of Max airmass for WFD i band.
Max airmass
HealpixSubsetSlicer
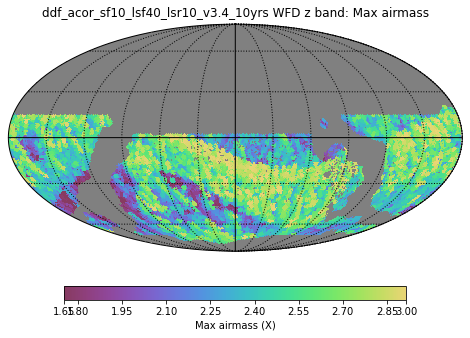
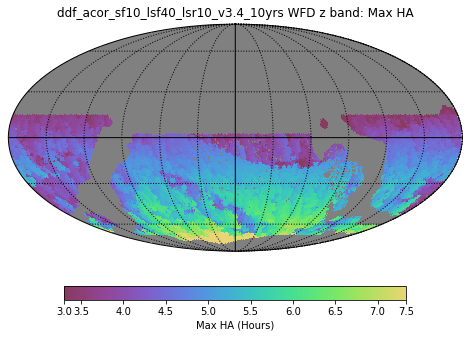
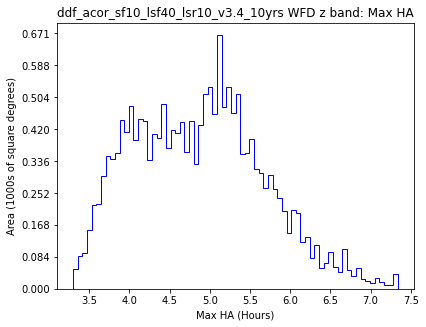
WFD z band
Map of Max airmass for WFD z band.
Max airmass
HealpixSubsetSlicer
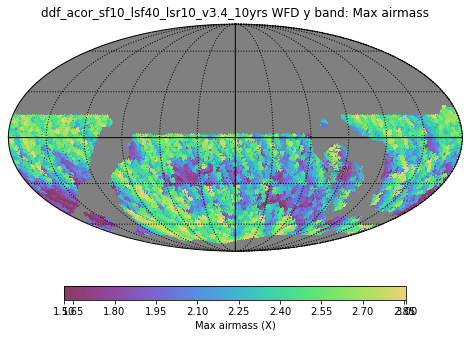
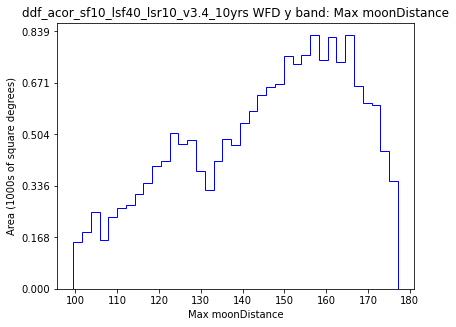
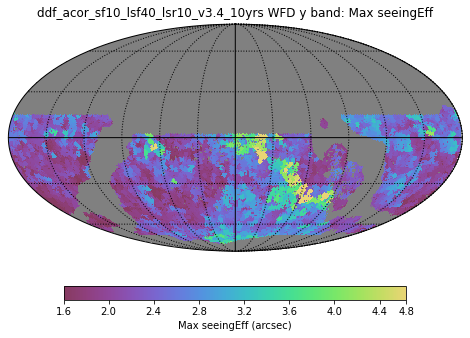
WFD y band
Map of Max airmass for WFD y band.
Median airmass
HealpixSubsetSlicer
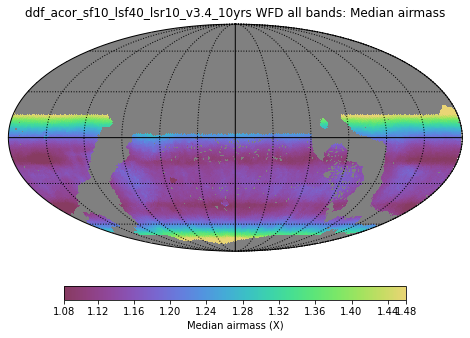
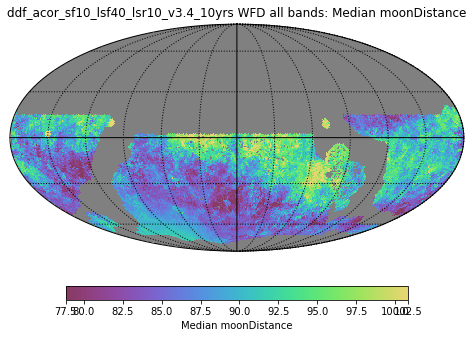
WFD all bands
Map of Median airmass for WFD all bands.
Median airmass
HealpixSubsetSlicer
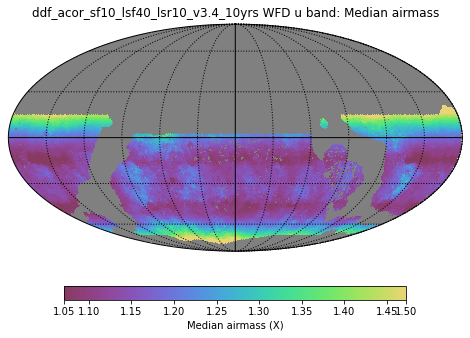
WFD u band
Map of Median airmass for WFD u band.
Median airmass
HealpixSubsetSlicer
WFD g band
Map of Median airmass for WFD g band.
Median airmass
HealpixSubsetSlicer
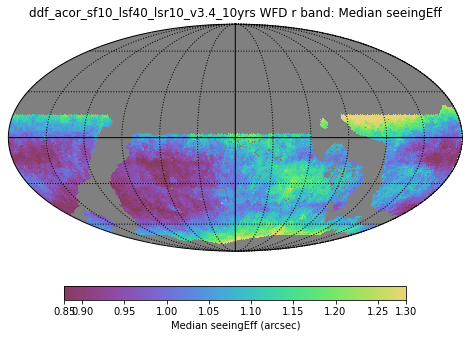
WFD r band
Map of Median airmass for WFD r band.
Median airmass
HealpixSubsetSlicer
WFD i band
Map of Median airmass for WFD i band.
Median airmass
HealpixSubsetSlicer
WFD z band
Map of Median airmass for WFD z band.
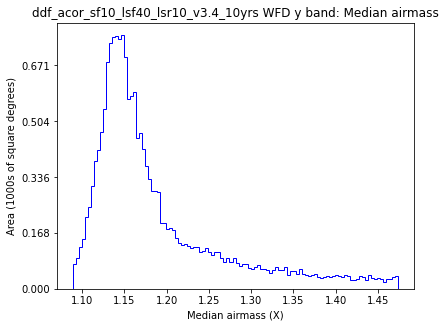
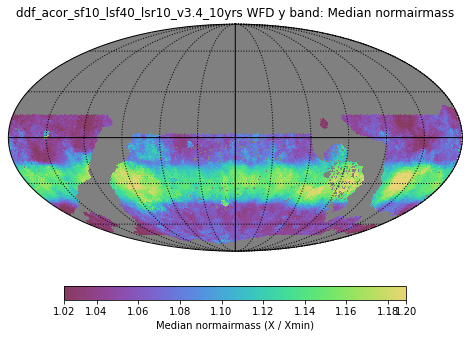
Median airmass
HealpixSubsetSlicer
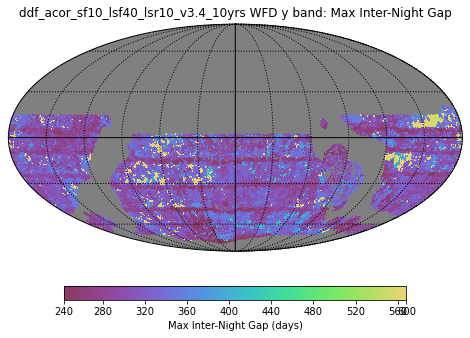
WFD y band
Map of Median airmass for WFD y band.
Min airmass
HealpixSubsetSlicer
WFD all bands
Map of Min airmass for WFD all bands.
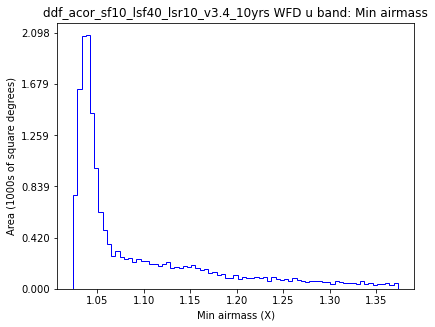
Min airmass
HealpixSubsetSlicer
WFD u band
Map of Min airmass for WFD u band.
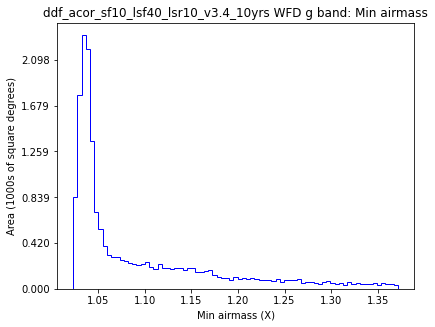
Min airmass
HealpixSubsetSlicer
WFD g band
Map of Min airmass for WFD g band.
Min airmass
HealpixSubsetSlicer
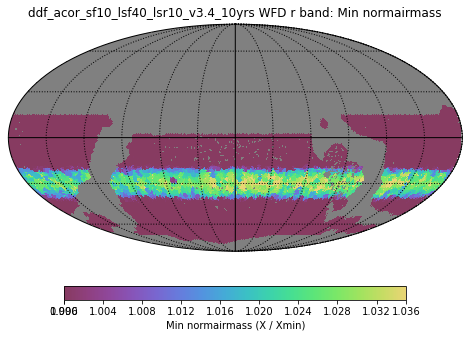
WFD r band
Map of Min airmass for WFD r band.
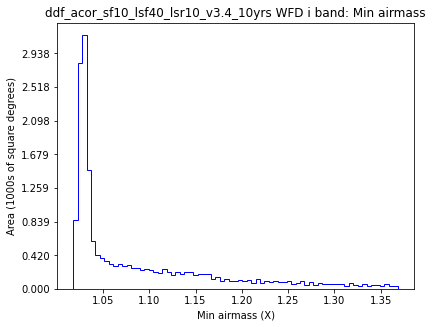
Min airmass
HealpixSubsetSlicer
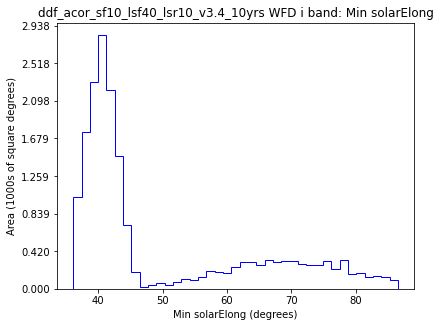
WFD i band
Map of Min airmass for WFD i band.
Min airmass
HealpixSubsetSlicer
WFD z band
Map of Min airmass for WFD z band.
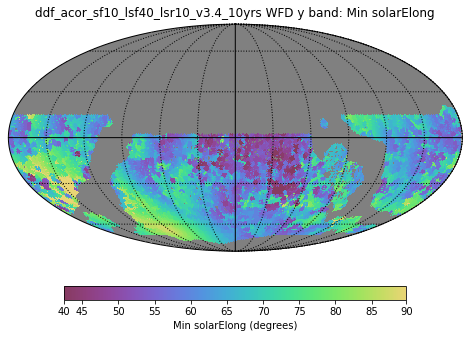
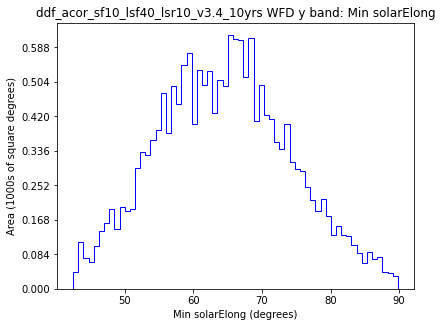
Min airmass
HealpixSubsetSlicer
WFD y band
Map of Min airmass for WFD y band.
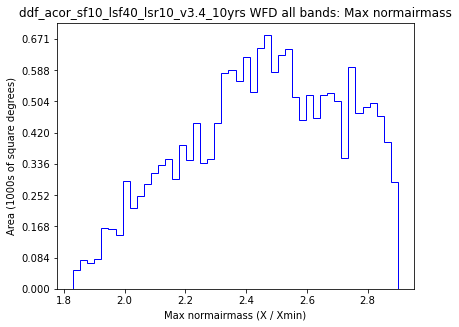
airmass Histogram
OneDSlicer
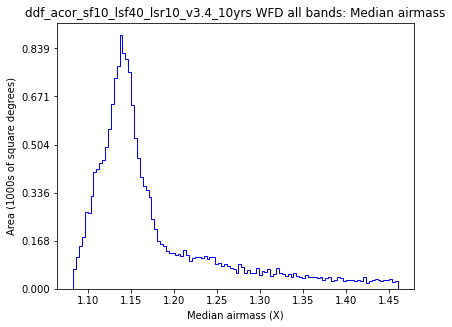
WFD all bands
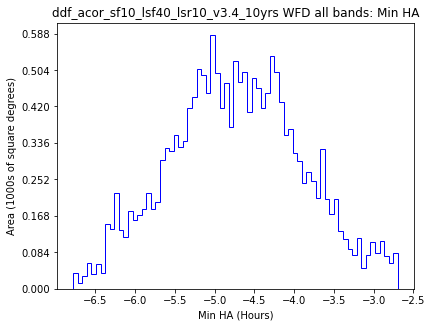
Histogram of airmass for WFD all bands.
airmass Histogram
OneDSlicer
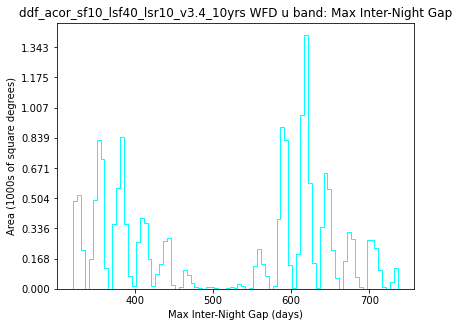
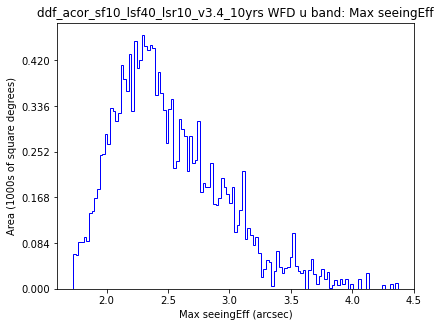
WFD u band
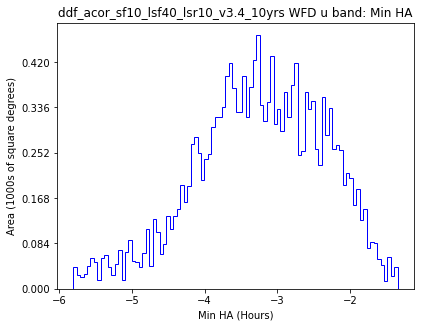
Histogram of airmass for WFD u band.
airmass Histogram
OneDSlicer
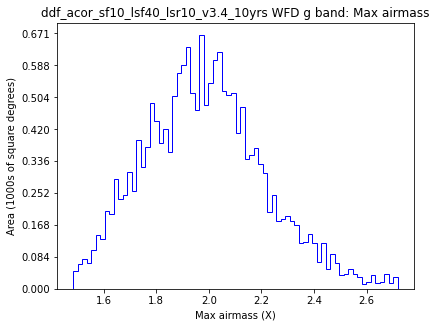
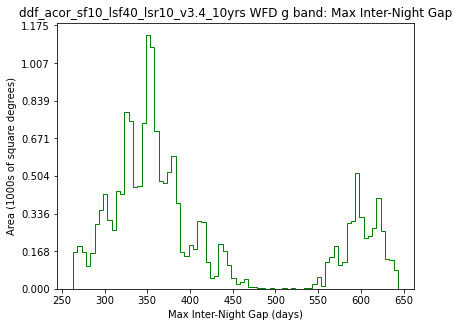
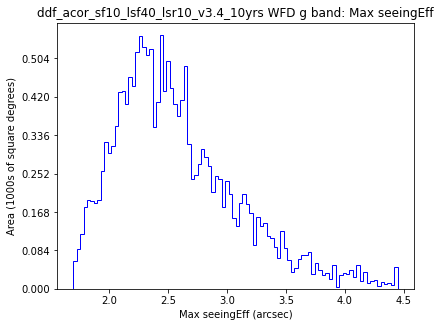
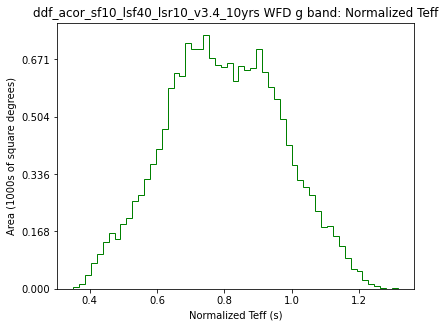
WFD g band
Histogram of airmass for WFD g band.
airmass Histogram
OneDSlicer
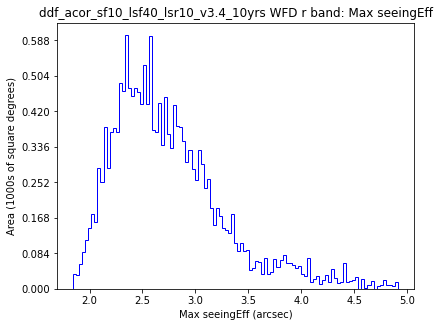
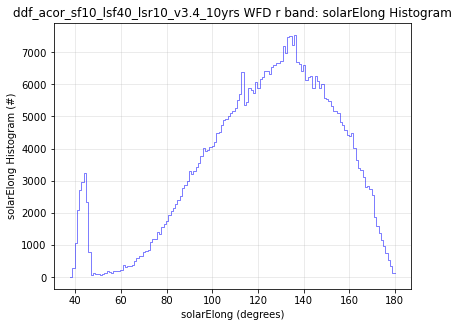
WFD r band
Histogram of airmass for WFD r band.
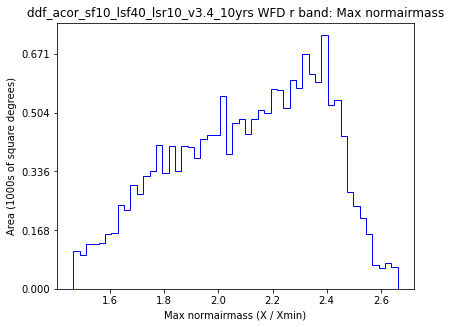
airmass Histogram
OneDSlicer
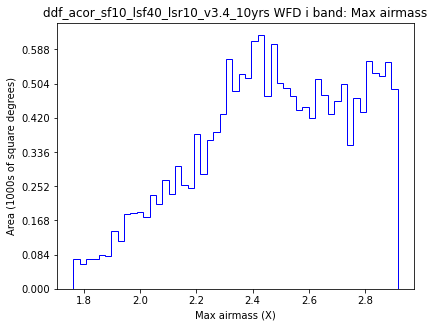
WFD i band
Histogram of airmass for WFD i band.
airmass Histogram
OneDSlicer
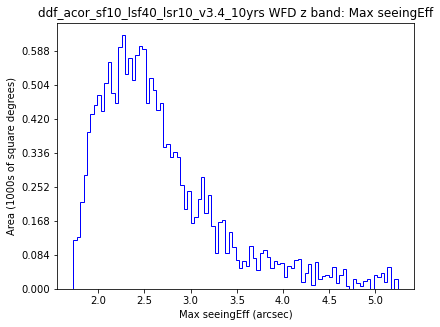
WFD z band
Histogram of airmass for WFD z band.
airmass Histogram
OneDSlicer
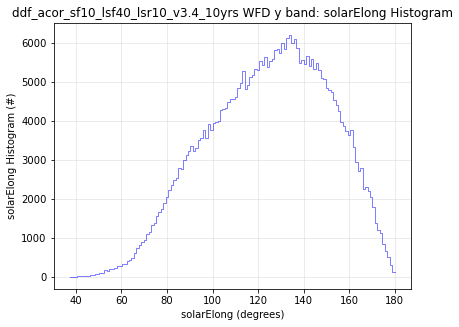
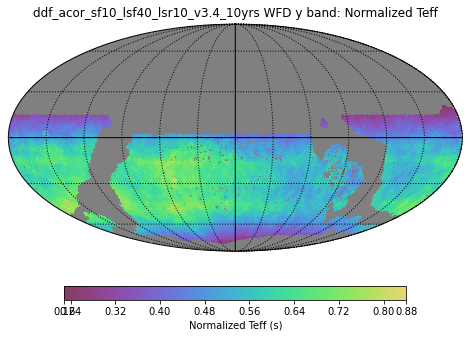
WFD y band
Histogram of airmass for WFD y band.
|
Group: Airmass; Subgroup: WFD; Slicer: HealpixSubsetSlicer
|
| Metric Name |
Info Label |
Median |
Mean |
Rms |
N(-3Sigma) |
N(+3Sigma) |
Count |
Min |
Max |
| Max airmass |
WFD all bands |
2.70
|
2.67
|
0.19
|
230
|
0
|
22469
|
1.79
|
2.92
|
| Median airmass |
WFD all bands |
1.15
|
1.18
|
0.09
|
0
|
464
|
22469
|
1.06
|
1.65
|
| Min airmass |
WFD all bands |
1.04
|
1.09
|
0.09
|
0
|
277
|
22469
|
1.00
|
1.54
|
| Max airmass |
WFD u band |
1.81
|
1.86
|
0.31
|
0
|
98
|
22469
|
1.22
|
2.91
|
| Median airmass |
WFD u band |
1.15
|
1.18
|
0.09
|
0
|
391
|
22469
|
1.05
|
1.63
|
| Min airmass |
WFD u band |
1.05
|
1.10
|
0.09
|
0
|
339
|
22469
|
1.02
|
1.55
|
| Max airmass |
WFD g band |
1.97
|
1.99
|
0.25
|
0
|
221
|
22469
|
1.30
|
2.91
|
| Median airmass |
WFD g band |
1.15
|
1.18
|
0.09
|
0
|
340
|
22469
|
1.05
|
1.74
|
| Min airmass |
WFD g band |
1.05
|
1.10
|
0.09
|
0
|
330
|
22469
|
1.00
|
1.54
|
| Max airmass |
WFD r band |
2.34
|
2.29
|
0.26
|
4
|
0
|
22469
|
1.41
|
2.92
|
| Median airmass |
WFD r band |
1.15
|
1.18
|
0.09
|
0
|
430
|
22469
|
1.06
|
1.67
|
| Min airmass |
WFD r band |
1.05
|
1.09
|
0.09
|
0
|
303
|
22469
|
1.00
|
1.54
|
| Max airmass |
WFD i band |
2.48
|
2.47
|
0.29
|
23
|
0
|
22469
|
1.37
|
2.92
|
| Median airmass |
WFD i band |
1.14
|
1.18
|
0.09
|
0
|
447
|
22469
|
1.05
|
1.67
|
| Min airmass |
WFD i band |
1.05
|
1.09
|
0.09
|
0
|
305
|
22469
|
1.00
|
1.54
|
| Max airmass |
WFD z band |
2.52
|
2.50
|
0.28
|
57
|
0
|
22469
|
1.44
|
2.92
|
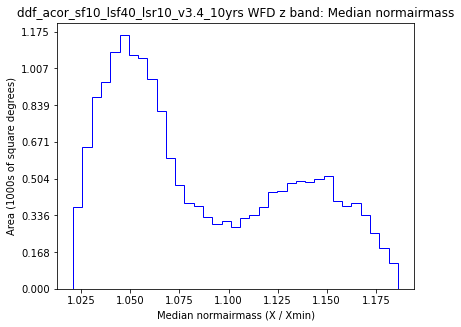
| Median airmass |
WFD z band |
1.16
|
1.19
|
0.08
|
0
|
437
|
22469
|
1.06
|
1.66
|
| Min airmass |
WFD z band |
1.05
|
1.09
|
0.09
|
0
|
298
|
22469
|
1.00
|
1.54
|
| Max airmass |
WFD y band |
2.35
|
2.32
|
0.30
|
2
|
0
|
22469
|
1.40
|
2.92
|
| Median airmass |
WFD y band |
1.16
|
1.19
|
0.09
|
0
|
437
|
22469
|
1.06
|
1.66
|
| Min airmass |
WFD y band |
1.05
|
1.09
|
0.09
|
0
|
319
|
22469
|
1.00
|
1.54
|
|
Group: Airmass; Subgroup: WFD; Slicer: UniSlicer
|
| |
25th%ile airmass |
75th%ile airmass |
Count airmass |
Max airmass |
Mean airmass |
Median airmass |
Min airmass |
N(+3Sigma) airmass |
N(-3Sigma) airmass |
Rms airmass |
| WFD all bands |
1.11
|
1.37
|
2147095
|
2.92
|
1.30
|
1.20
|
1.00
|
60096
|
0
|
0.29
|
| WFD g band |
1.11
|
1.39
|
196987
|
2.91
|
1.29
|
1.20
|
1.00
|
3883
|
0
|
0.26
|
| WFD i band |
1.11
|
1.37
|
500895
|
2.92
|
1.31
|
1.19
|
1.00
|
14246
|
0
|
0.32
|
| WFD r band |
1.11
|
1.36
|
489465
|
2.92
|
1.29
|
1.19
|
1.00
|
14398
|
0
|
0.28
|
| WFD u band |
1.11
|
1.33
|
124477
|
2.91
|
1.25
|
1.19
|
1.02
|
2543
|
0
|
0.21
|
| WFD y band |
1.12
|
1.35
|
394073
|
2.92
|
1.28
|
1.20
|
1.00
|
9009
|
0
|
0.24
|
| WFD z band |
1.11
|
1.40
|
441198
|
2.92
|
1.33
|
1.21
|
1.00
|
12092
|
0
|
0.33
|
Group: Airmass; Subgroup: Yr 1
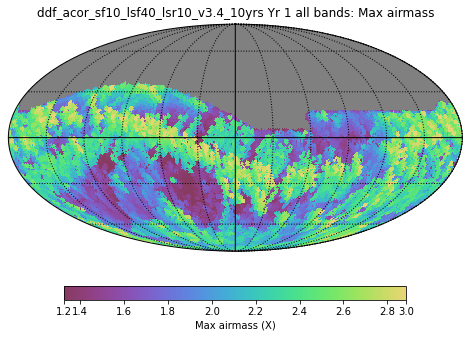
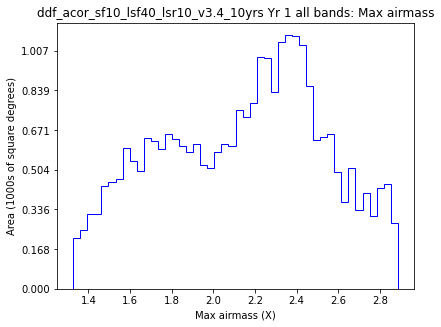
Max airmass
HealpixSlicer
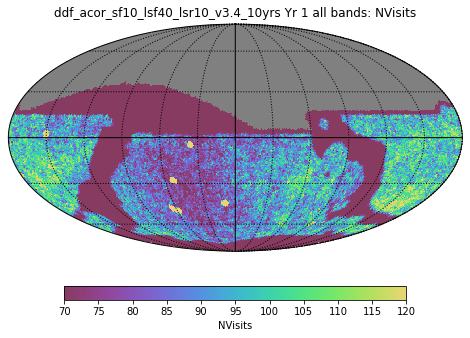
Yr 1 all bands
Map of Max airmass for Yr 1 all bands.
Max airmass
HealpixSlicer
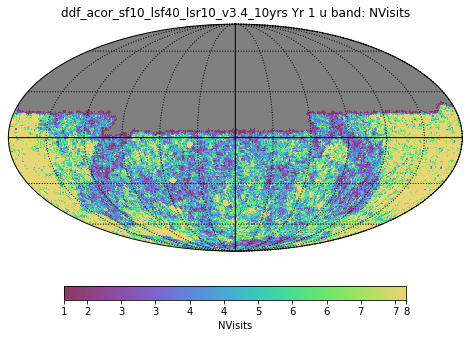
Yr 1 u band
Map of Max airmass for Yr 1 u band.
Max airmass
HealpixSlicer
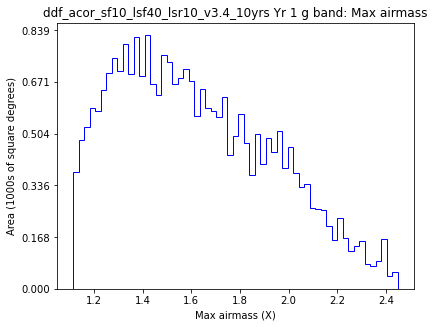
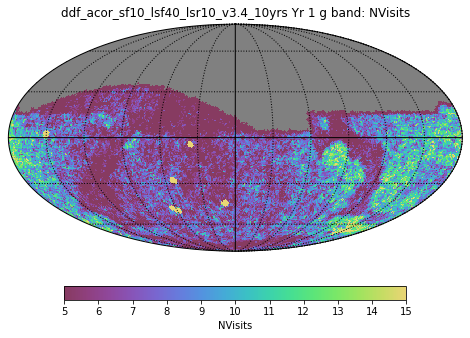
Yr 1 g band
Map of Max airmass for Yr 1 g band.
Max airmass
HealpixSlicer
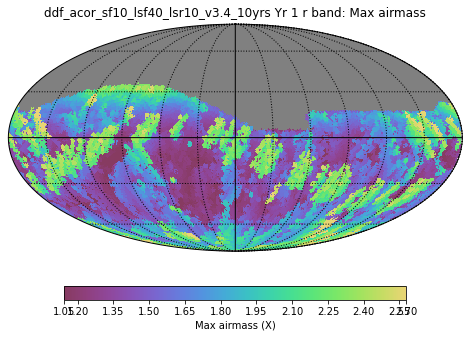
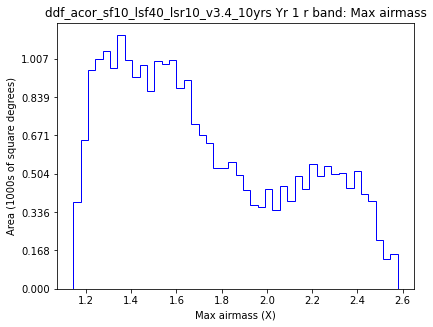
Yr 1 r band
Map of Max airmass for Yr 1 r band.
Max airmass
HealpixSlicer
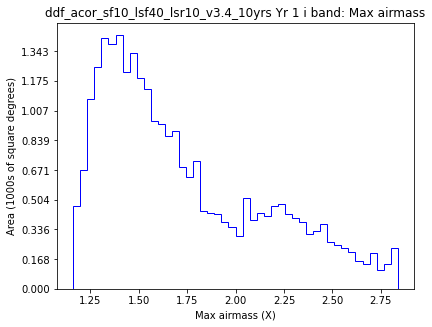
Yr 1 i band
Map of Max airmass for Yr 1 i band.
Max airmass
HealpixSlicer
Yr 1 z band
Map of Max airmass for Yr 1 z band.
Max airmass
HealpixSlicer
Yr 1 y band
Map of Max airmass for Yr 1 y band.
Median airmass
HealpixSlicer
Yr 1 all bands
Map of Median airmass for Yr 1 all bands.
Median airmass
HealpixSlicer
Yr 1 u band
Map of Median airmass for Yr 1 u band.
Median airmass
HealpixSlicer
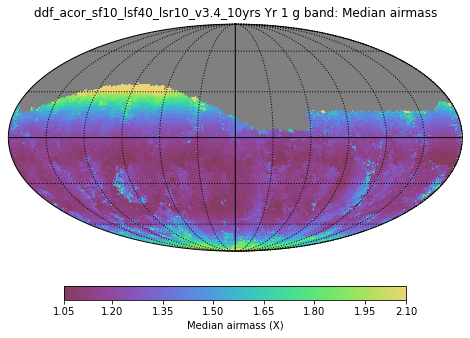
Yr 1 g band
Map of Median airmass for Yr 1 g band.
Median airmass
HealpixSlicer
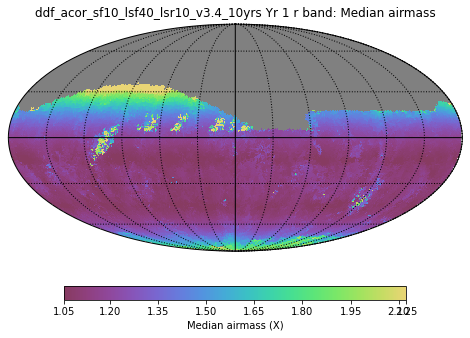
Yr 1 r band
Map of Median airmass for Yr 1 r band.
Median airmass
HealpixSlicer
Yr 1 i band
Map of Median airmass for Yr 1 i band.
Median airmass
HealpixSlicer
Yr 1 z band
Map of Median airmass for Yr 1 z band.
Median airmass
HealpixSlicer
Yr 1 y band
Map of Median airmass for Yr 1 y band.
Min airmass
HealpixSlicer
Yr 1 all bands
Map of Min airmass for Yr 1 all bands.
Min airmass
HealpixSlicer
Yr 1 u band
Map of Min airmass for Yr 1 u band.
Min airmass
HealpixSlicer
Yr 1 g band
Map of Min airmass for Yr 1 g band.
Min airmass
HealpixSlicer
Yr 1 r band
Map of Min airmass for Yr 1 r band.
Min airmass
HealpixSlicer
Yr 1 i band
Map of Min airmass for Yr 1 i band.
Min airmass
HealpixSlicer
Yr 1 z band
Map of Min airmass for Yr 1 z band.
Min airmass
HealpixSlicer
Yr 1 y band
Map of Min airmass for Yr 1 y band.
airmass Histogram
OneDSlicer
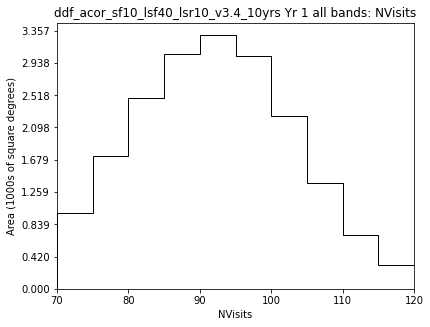
Yr 1 all bands
Histogram of airmass for Yr 1 all bands.
airmass Histogram
OneDSlicer
Yr 1 u band
Histogram of airmass for Yr 1 u band.
airmass Histogram
OneDSlicer
Yr 1 g band
Histogram of airmass for Yr 1 g band.
airmass Histogram
OneDSlicer
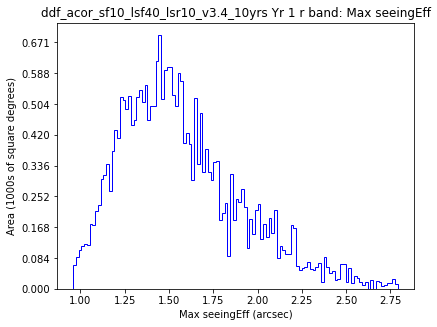
Yr 1 r band
Histogram of airmass for Yr 1 r band.
airmass Histogram
OneDSlicer
Yr 1 i band
Histogram of airmass for Yr 1 i band.
airmass Histogram
OneDSlicer
Yr 1 z band
Histogram of airmass for Yr 1 z band.
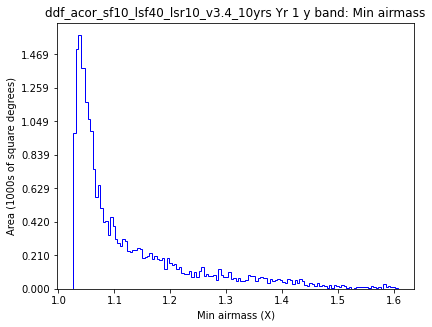
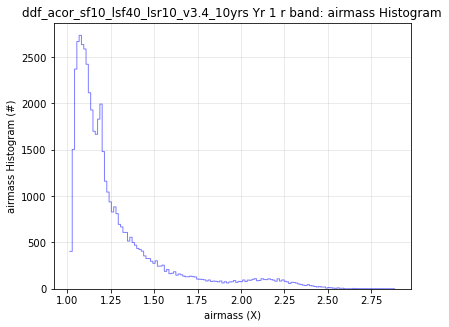
airmass Histogram
OneDSlicer
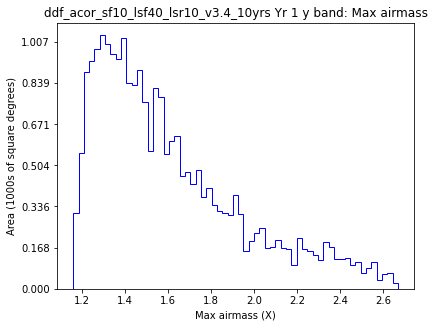
Yr 1 y band
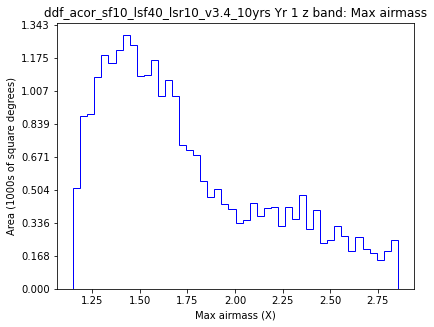
Histogram of airmass for Yr 1 y band.
|
Group: Airmass; Subgroup: Yr 1; Slicer: HealpixSlicer
|
| Metric Name |
Info Label |
Median |
Mean |
Rms |
N(-3Sigma) |
N(+3Sigma) |
Count |
Min |
Max |
| Max airmass |
Yr 1 all bands |
2.19
|
2.14
|
0.40
|
0
|
0
|
33393
|
1.11
|
2.92
|
| Median airmass |
Yr 1 all bands |
1.15
|
1.25
|
0.21
|
0
|
825
|
33393
|
1.04
|
2.74
|
| Min airmass |
Yr 1 all bands |
1.08
|
1.16
|
0.20
|
0
|
786
|
33393
|
1.00
|
2.57
|
| Max airmass |
Yr 1 u band |
1.46
|
1.54
|
0.33
|
0
|
370
|
29487
|
1.03
|
2.91
|
| Median airmass |
Yr 1 u band |
1.18
|
1.24
|
0.16
|
0
|
635
|
29487
|
1.03
|
2.37
|
| Min airmass |
Yr 1 u band |
1.10
|
1.15
|
0.13
|
0
|
601
|
29487
|
1.02
|
2.03
|
| Max airmass |
Yr 1 g band |
1.58
|
1.63
|
0.33
|
0
|
87
|
33183
|
1.05
|
2.90
|
| Median airmass |
Yr 1 g band |
1.20
|
1.28
|
0.22
|
0
|
707
|
33183
|
1.01
|
2.53
|
| Min airmass |
Yr 1 g band |
1.11
|
1.19
|
0.20
|
0
|
806
|
33183
|
1.00
|
2.53
|
| Max airmass |
Yr 1 r band |
1.63
|
1.72
|
0.40
|
0
|
0
|
33246
|
1.05
|
2.88
|
| Median airmass |
Yr 1 r band |
1.16
|
1.25
|
0.23
|
0
|
876
|
33246
|
1.03
|
2.55
|
| Min airmass |
Yr 1 r band |
1.08
|
1.17
|
0.20
|
0
|
784
|
33246
|
1.02
|
2.55
|
| Max airmass |
Yr 1 i band |
1.61
|
1.74
|
0.43
|
0
|
0
|
33311
|
1.06
|
2.92
|
| Median airmass |
Yr 1 i band |
1.15
|
1.25
|
0.23
|
0
|
884
|
33311
|
1.03
|
2.91
|
| Min airmass |
Yr 1 i band |
1.08
|
1.17
|
0.21
|
0
|
830
|
33311
|
1.00
|
2.91
|
| Max airmass |
Yr 1 z band |
1.63
|
1.75
|
0.45
|
0
|
0
|
33255
|
1.06
|
2.92
|
| Median airmass |
Yr 1 z band |
1.17
|
1.26
|
0.24
|
0
|
863
|
33255
|
1.04
|
2.81
|
| Min airmass |
Yr 1 z band |
1.09
|
1.18
|
0.21
|
0
|
806
|
33255
|
1.01
|
2.77
|
| Max airmass |
Yr 1 y band |
1.52
|
1.62
|
0.36
|
0
|
239
|
29670
|
1.07
|
2.90
|
| Median airmass |
Yr 1 y band |
1.16
|
1.21
|
0.14
|
0
|
558
|
29670
|
1.04
|
2.33
|
| Min airmass |
Yr 1 y band |
1.08
|
1.13
|
0.13
|
0
|
554
|
29670
|
1.01
|
2.06
|
|
Group: Airmass; Subgroup: Yr 1; Slicer: UniSlicer
|
| |
25th%ile airmass |
75th%ile airmass |
Count airmass |
Max airmass |
Mean airmass |
Median airmass |
Min airmass |
N(+3Sigma) airmass |
N(-3Sigma) airmass |
Rms airmass |
| Yr 1 all bands |
1.10
|
1.34
|
241913
|
2.92
|
1.28
|
1.18
|
1.00
|
7126
|
0
|
0.28
|
| Yr 1 g band |
1.12
|
1.43
|
23394
|
2.90
|
1.32
|
1.22
|
1.00
|
322
|
0
|
0.27
|
| Yr 1 i band |
1.10
|
1.32
|
56225
|
2.92
|
1.28
|
1.17
|
1.00
|
1838
|
0
|
0.30
|
| Yr 1 r band |
1.10
|
1.34
|
50660
|
2.88
|
1.28
|
1.18
|
1.02
|
1580
|
0
|
0.29
|
| Yr 1 u band |
1.11
|
1.37
|
16822
|
2.91
|
1.28
|
1.20
|
1.02
|
360
|
0
|
0.25
|
| Yr 1 y band |
1.11
|
1.31
|
49401
|
2.90
|
1.25
|
1.18
|
1.01
|
1180
|
0
|
0.22
|
| Yr 1 z band |
1.11
|
1.36
|
45411
|
2.92
|
1.30
|
1.19
|
1.01
|
1474
|
0
|
0.32
|
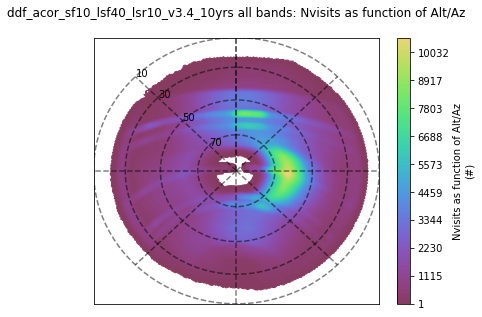
Group: Alt/Az; Subgroup: All Observations
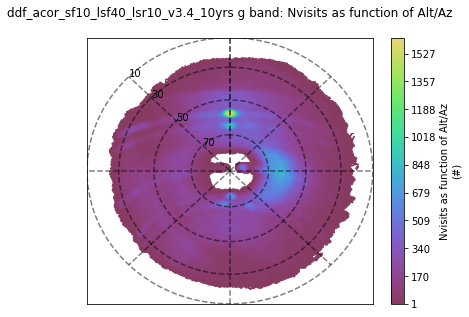
Nvisits as function of Alt/Az
HealpixSlicer
all bands
Alt/Az pointing distribution for filter all
Group: Alt/Az; Subgroup: Per filter
Nvisits as function of Alt/Az
HealpixSlicer
u band
Alt/Az pointing distribution for filter u
Nvisits as function of Alt/Az
HealpixSlicer
g band
Alt/Az pointing distribution for filter g
Nvisits as function of Alt/Az
HealpixSlicer
r band
Alt/Az pointing distribution for filter r
Nvisits as function of Alt/Az
HealpixSlicer
i band
Alt/Az pointing distribution for filter i
Nvisits as function of Alt/Az
HealpixSlicer
z band
Alt/Az pointing distribution for filter z
Nvisits as function of Alt/Az
HealpixSlicer
y band
Alt/Az pointing distribution for filter y
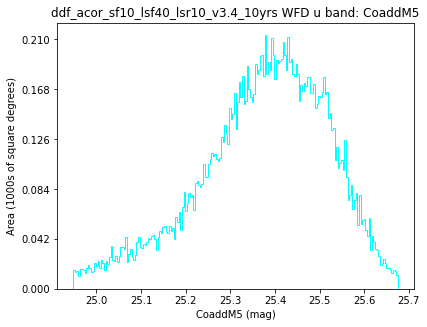
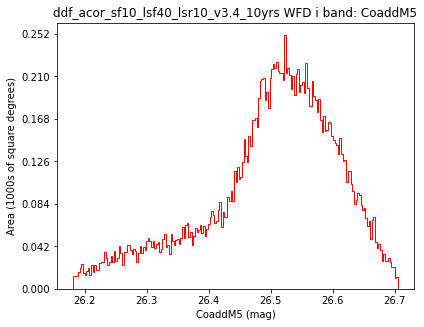
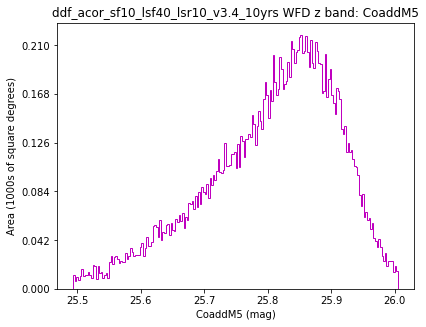
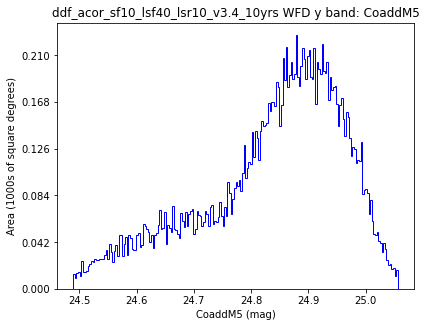
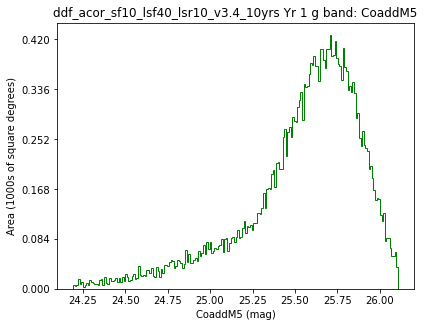
Group: Coadded M5 Maps; Subgroup: All sky
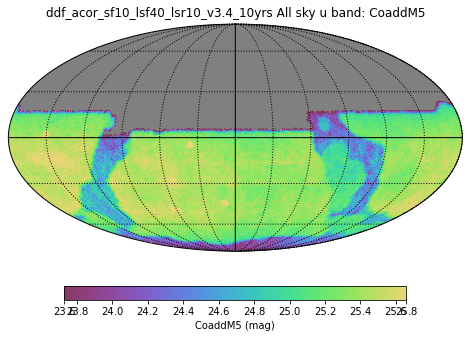
CoaddM5
HealpixSlicer
All sky u band
Coadded depth per healpix in All sky u band. More positive numbers indicate fainter limiting magnitudes.
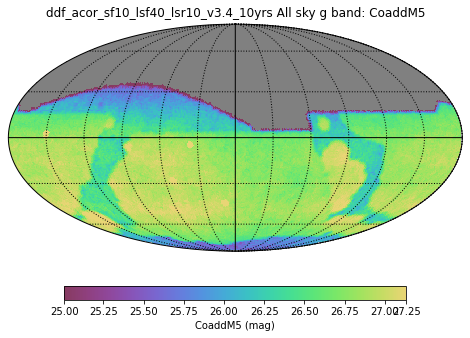
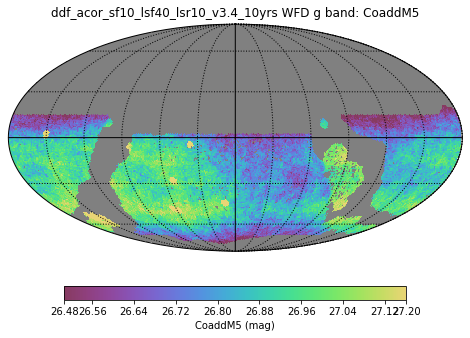
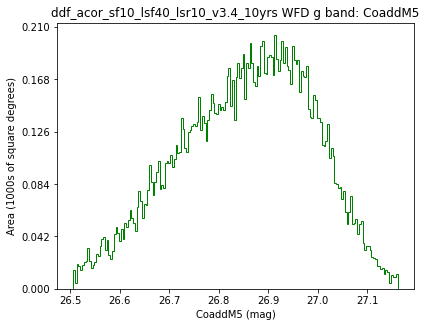
CoaddM5
HealpixSlicer
All sky g band
Coadded depth per healpix in All sky g band. More positive numbers indicate fainter limiting magnitudes.
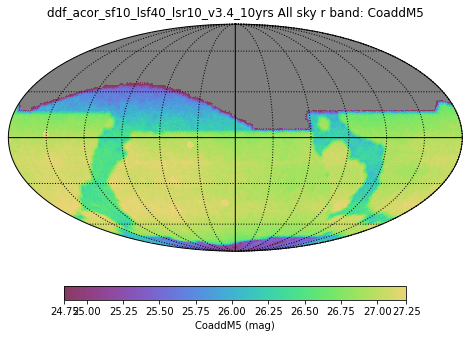
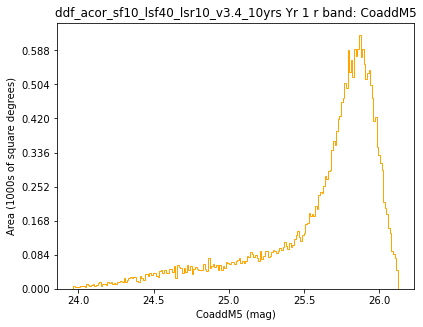
CoaddM5
HealpixSlicer
All sky r band
Coadded depth per healpix in All sky r band. More positive numbers indicate fainter limiting magnitudes.
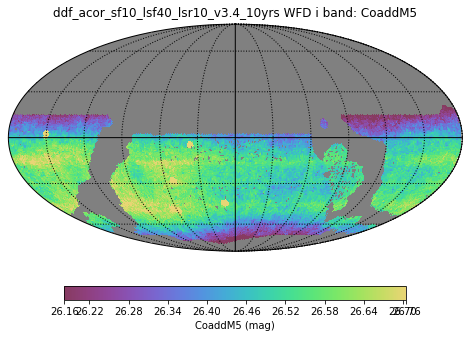
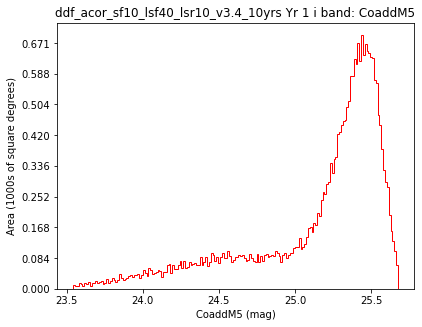
CoaddM5
HealpixSlicer
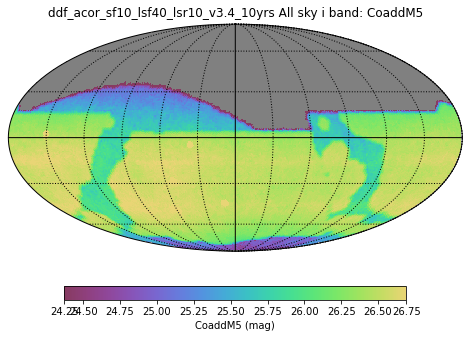
All sky i band
Coadded depth per healpix in All sky i band. More positive numbers indicate fainter limiting magnitudes.
CoaddM5
HealpixSlicer
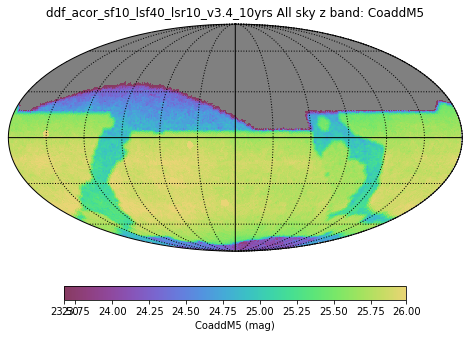
All sky z band
Coadded depth per healpix in All sky z band. More positive numbers indicate fainter limiting magnitudes.
CoaddM5
HealpixSlicer
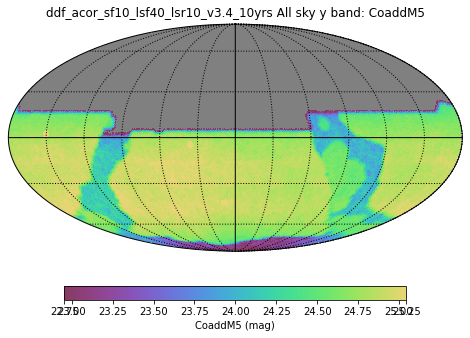
All sky y band
Coadded depth per healpix in All sky y band. More positive numbers indicate fainter limiting magnitudes.
|
Group: Coadded M5 Maps; Subgroup: All sky; Slicer: HealpixSlicer
|
| Metric Name |
Info Label |
Median |
Mean |
Rms |
N(-3Sigma) |
N(+3Sigma) |
Count |
Min |
Max |
| CoaddM5 |
All sky u band |
25.33
|
25.18
|
0.45
|
404
|
77
|
29864
|
21.70
|
27.34
|
| CoaddM5 |
All sky g band |
26.78
|
26.64
|
0.45
|
469
|
93
|
33481
|
22.42
|
28.96
|
| CoaddM5 |
All sky r band |
26.93
|
26.71
|
0.53
|
481
|
70
|
33540
|
22.49
|
28.98
|
| CoaddM5 |
All sky i band |
26.45
|
26.21
|
0.54
|
436
|
75
|
33538
|
22.19
|
28.60
|
| CoaddM5 |
All sky z band |
25.75
|
25.50
|
0.56
|
413
|
83
|
33510
|
21.59
|
28.10
|
| CoaddM5 |
All sky y band |
24.81
|
24.64
|
0.46
|
747
|
71
|
29952
|
20.71
|
26.64
|
Group: Coadded M5 Maps; Subgroup: WFD
CoaddM5
HealpixSubsetSlicer
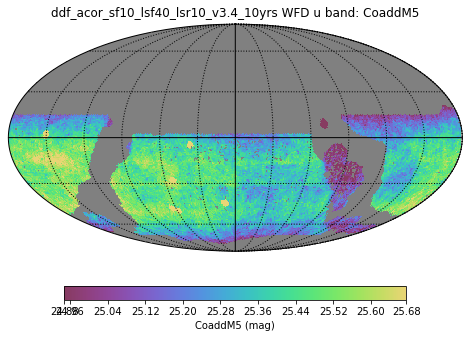
WFD u band
Coadded depth per healpix in WFD u band. More positive numbers indicate fainter limiting magnitudes.
CoaddM5
HealpixSubsetSlicer
WFD g band
Coadded depth per healpix in WFD g band. More positive numbers indicate fainter limiting magnitudes.
CoaddM5
HealpixSubsetSlicer
WFD r band
Coadded depth per healpix in WFD r band. More positive numbers indicate fainter limiting magnitudes.
CoaddM5
HealpixSubsetSlicer
WFD i band
Coadded depth per healpix in WFD i band. More positive numbers indicate fainter limiting magnitudes.
CoaddM5
HealpixSubsetSlicer
WFD z band
Coadded depth per healpix in WFD z band. More positive numbers indicate fainter limiting magnitudes.
CoaddM5
HealpixSubsetSlicer
WFD y band
Coadded depth per healpix in WFD y band. More positive numbers indicate fainter limiting magnitudes.
|
Group: Coadded M5 Maps; Subgroup: WFD; Slicer: HealpixSubsetSlicer
|
| Metric Name |
Info Label |
Median |
Mean |
Rms |
N(-3Sigma) |
N(+3Sigma) |
Count |
Min |
Max |
| CoaddM5 |
WFD u band |
25.39
|
25.37
|
0.18
|
49
|
111
|
22469
|
24.53
|
27.34
|
| CoaddM5 |
WFD g band |
26.86
|
26.86
|
0.18
|
0
|
115
|
22469
|
26.33
|
28.96
|
| CoaddM5 |
WFD r band |
27.00
|
27.00
|
0.15
|
0
|
115
|
22469
|
26.55
|
28.98
|
| CoaddM5 |
WFD i band |
26.52
|
26.50
|
0.16
|
1
|
116
|
22469
|
26.03
|
28.60
|
| CoaddM5 |
WFD z band |
25.82
|
25.81
|
0.16
|
0
|
120
|
22469
|
25.35
|
28.10
|
| CoaddM5 |
WFD y band |
24.86
|
24.84
|
0.16
|
12
|
110
|
22469
|
24.27
|
26.64
|
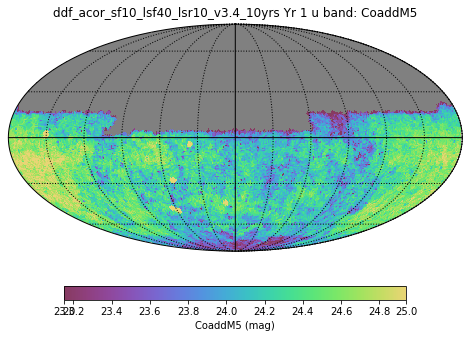
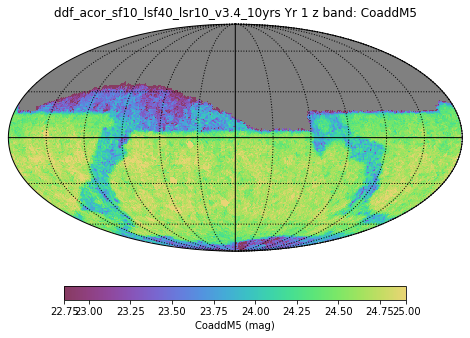
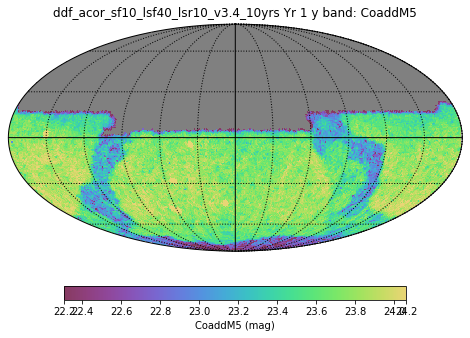
Group: Coadded M5 Maps; Subgroup: Yr 1
CoaddM5
HealpixSlicer
Yr 1 u band
Coadded depth per healpix in Yr 1 u band. More positive numbers indicate fainter limiting magnitudes.
CoaddM5
HealpixSlicer
Yr 1 g band
Coadded depth per healpix in Yr 1 g band. More positive numbers indicate fainter limiting magnitudes.
CoaddM5
HealpixSlicer
Yr 1 r band
Coadded depth per healpix in Yr 1 r band. More positive numbers indicate fainter limiting magnitudes.
CoaddM5
HealpixSlicer
Yr 1 i band
Coadded depth per healpix in Yr 1 i band. More positive numbers indicate fainter limiting magnitudes.
CoaddM5
HealpixSlicer
Yr 1 z band
Coadded depth per healpix in Yr 1 z band. More positive numbers indicate fainter limiting magnitudes.
CoaddM5
HealpixSlicer
Yr 1 y band
Coadded depth per healpix in Yr 1 y band. More positive numbers indicate fainter limiting magnitudes.
|
Group: Coadded M5 Maps; Subgroup: Yr 1; Slicer: HealpixSlicer
|
| Metric Name |
Info Label |
Median |
Mean |
Rms |
N(-3Sigma) |
N(+3Sigma) |
Count |
Min |
Max |
| CoaddM5 |
Yr 1 u band |
24.27
|
24.24
|
0.36
|
287
|
56
|
29487
|
22.06
|
26.62
|
| CoaddM5 |
Yr 1 g band |
25.62
|
25.54
|
0.40
|
466
|
79
|
33183
|
22.25
|
28.18
|
| CoaddM5 |
Yr 1 r band |
25.76
|
25.59
|
0.48
|
512
|
55
|
33246
|
22.21
|
28.21
|
| CoaddM5 |
Yr 1 i band |
25.33
|
25.14
|
0.51
|
413
|
57
|
33311
|
22.17
|
27.85
|
| CoaddM5 |
Yr 1 z band |
24.56
|
24.38
|
0.48
|
417
|
81
|
33255
|
21.59
|
27.34
|
| CoaddM5 |
Yr 1 y band |
23.69
|
23.59
|
0.37
|
511
|
57
|
29670
|
21.01
|
25.82
|
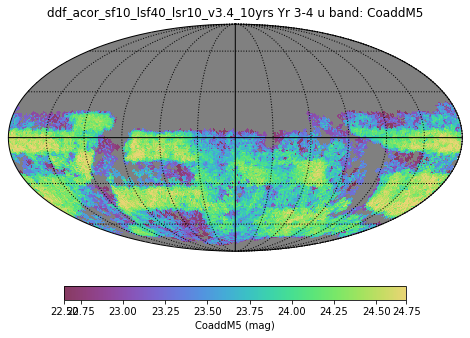
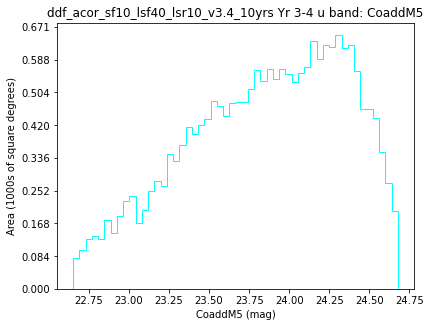
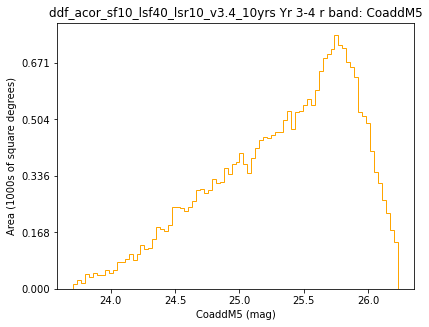
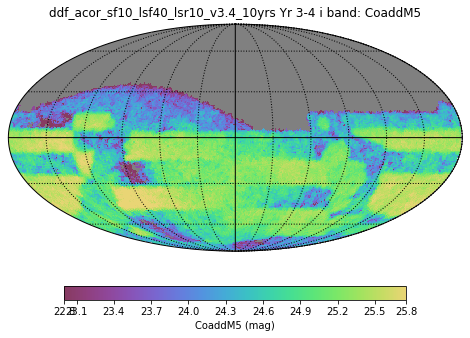
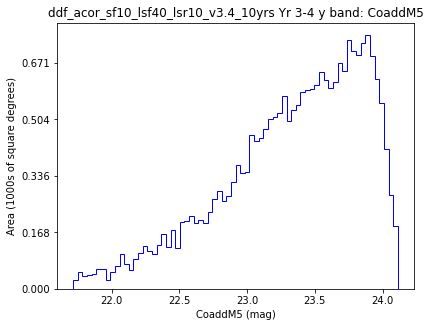
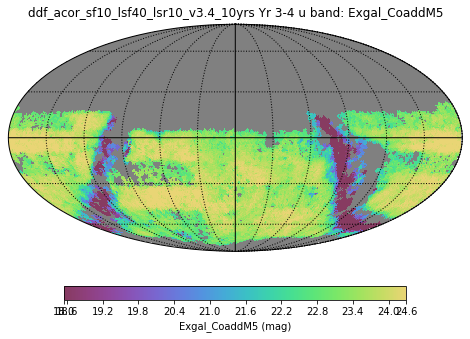
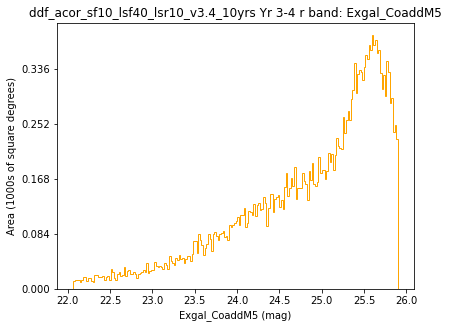
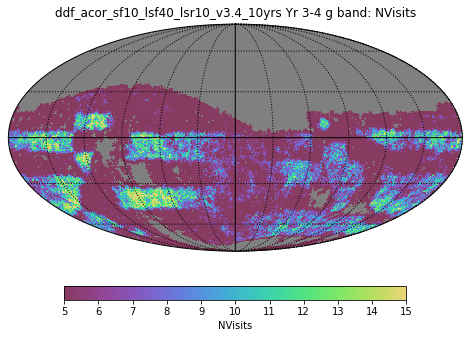
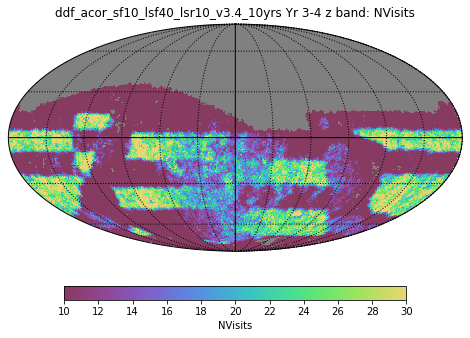
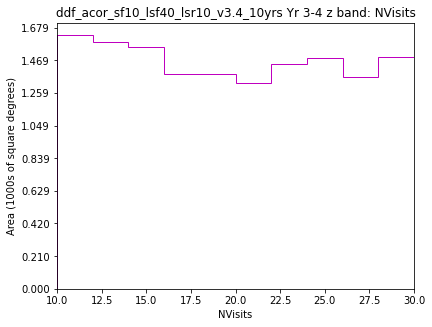
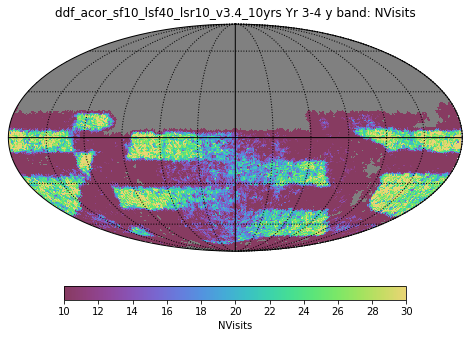
Group: Coadded M5 Maps; Subgroup: Yr 3-4
CoaddM5
HealpixSlicer
Yr 3-4 u band
Coadded depth per healpix in Yr 3-4 u band. More positive numbers indicate fainter limiting magnitudes.
CoaddM5
HealpixSlicer
Yr 3-4 g band
Coadded depth per healpix in Yr 3-4 g band. More positive numbers indicate fainter limiting magnitudes.
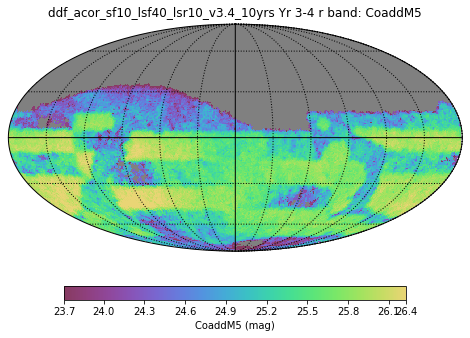
CoaddM5
HealpixSlicer
Yr 3-4 r band
Coadded depth per healpix in Yr 3-4 r band. More positive numbers indicate fainter limiting magnitudes.
CoaddM5
HealpixSlicer
Yr 3-4 i band
Coadded depth per healpix in Yr 3-4 i band. More positive numbers indicate fainter limiting magnitudes.
CoaddM5
HealpixSlicer
Yr 3-4 z band
Coadded depth per healpix in Yr 3-4 z band. More positive numbers indicate fainter limiting magnitudes.
CoaddM5
HealpixSlicer
Yr 3-4 y band
Coadded depth per healpix in Yr 3-4 y band. More positive numbers indicate fainter limiting magnitudes.
|
Group: Coadded M5 Maps; Subgroup: Yr 3-4; Slicer: HealpixSlicer
|
| Metric Name |
Info Label |
Median |
Mean |
Rms |
N(-3Sigma) |
N(+3Sigma) |
Count |
Min |
Max |
| CoaddM5 |
Yr 3-4 u band |
23.90
|
23.84
|
0.51
|
24
|
0
|
25293
|
22.10
|
24.89
|
| CoaddM5 |
Yr 3-4 g band |
25.32
|
25.23
|
0.54
|
150
|
0
|
31207
|
22.77
|
26.37
|
| CoaddM5 |
Yr 3-4 r band |
25.44
|
25.33
|
0.58
|
219
|
0
|
32828
|
22.19
|
26.47
|
| CoaddM5 |
Yr 3-4 i band |
24.93
|
24.81
|
0.63
|
260
|
0
|
33071
|
21.89
|
25.98
|
| CoaddM5 |
Yr 3-4 z band |
24.28
|
24.15
|
0.63
|
154
|
0
|
32970
|
21.63
|
25.28
|
| CoaddM5 |
Yr 3-4 y band |
23.43
|
23.32
|
0.55
|
236
|
0
|
29027
|
20.88
|
24.29
|
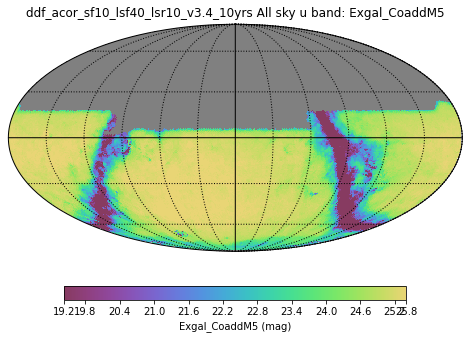
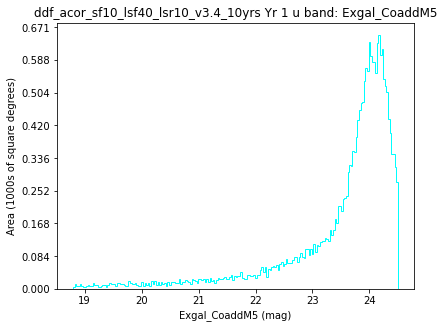
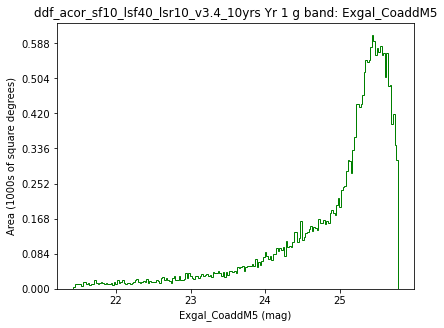
Group: Extragalactic Coadded M5 Maps; Subgroup: All sky
Exgal_CoaddM5
HealpixSlicer
All sky u band
Coadded depth per healpix for extragalactic purposes (i.e. combined with dust extinction maps), in All sky u band. More positive numbers indicate fainter limiting magnitudes.
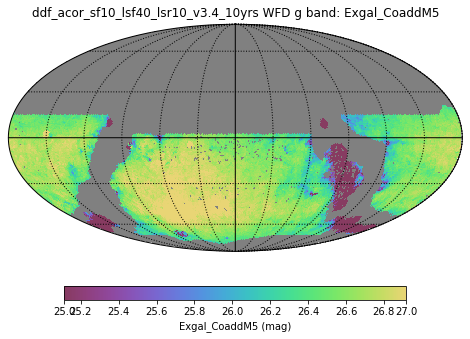
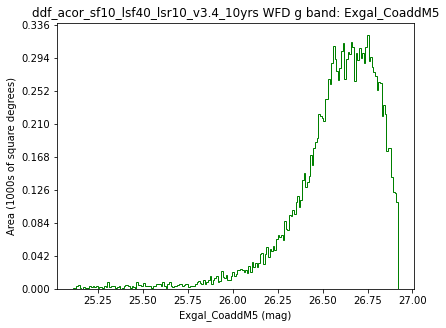
Exgal_CoaddM5
HealpixSlicer
All sky g band
Coadded depth per healpix for extragalactic purposes (i.e. combined with dust extinction maps), in All sky g band. More positive numbers indicate fainter limiting magnitudes.
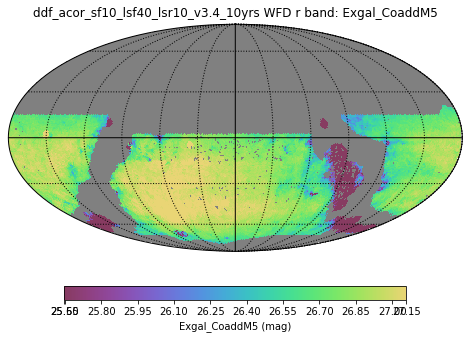
Exgal_CoaddM5
HealpixSlicer
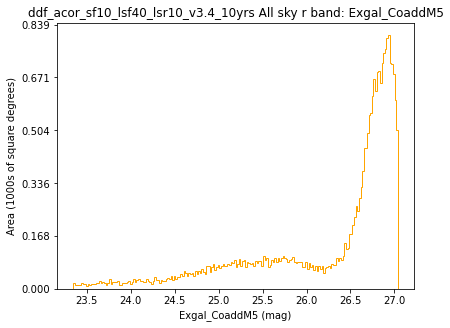
All sky r band
Coadded depth per healpix for extragalactic purposes (i.e. combined with dust extinction maps), in All sky r band. More positive numbers indicate fainter limiting magnitudes.
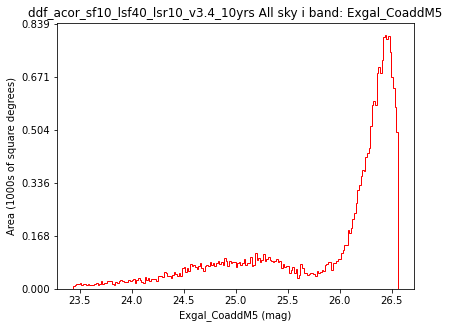
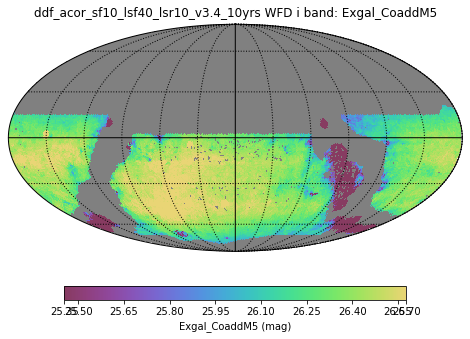
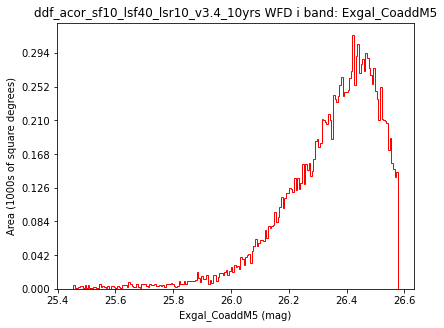
Exgal_CoaddM5
HealpixSlicer
All sky i band
Coadded depth per healpix for extragalactic purposes (i.e. combined with dust extinction maps), in All sky i band. More positive numbers indicate fainter limiting magnitudes.
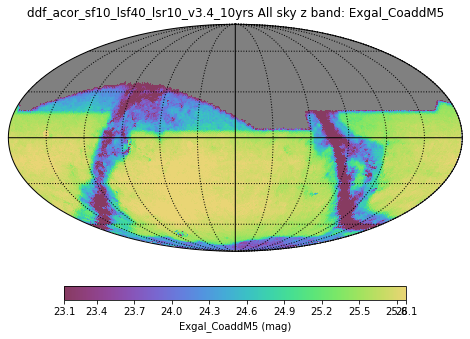
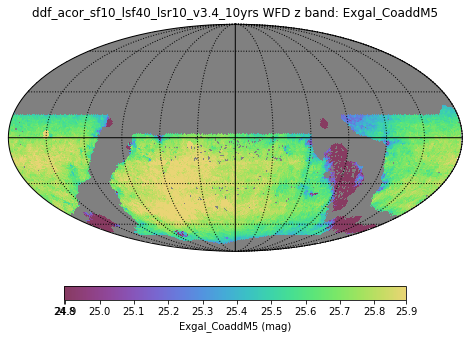
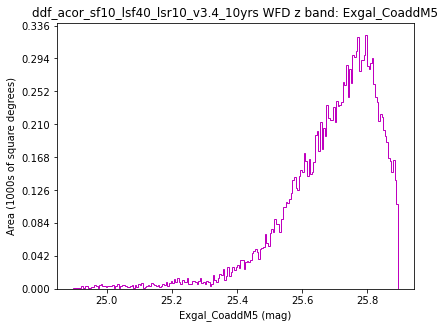
Exgal_CoaddM5
HealpixSlicer
All sky z band
Coadded depth per healpix for extragalactic purposes (i.e. combined with dust extinction maps), in All sky z band. More positive numbers indicate fainter limiting magnitudes.
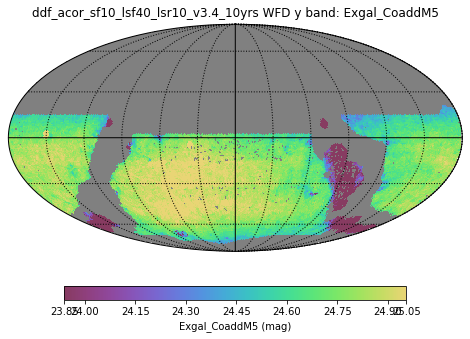
Exgal_CoaddM5
HealpixSlicer
All sky y band
Coadded depth per healpix for extragalactic purposes (i.e. combined with dust extinction maps), in All sky y band. More positive numbers indicate fainter limiting magnitudes.
|
Group: Extragalactic Coadded M5 Maps; Subgroup: All sky; Slicer: HealpixSlicer
|
| Metric Name |
Info Label |
Median |
Mean |
Rms |
N(-3Sigma) |
N(+3Sigma) |
Count |
Min |
Max |
| Exgal_CoaddM5 |
All sky u band |
25.00
|
23.58
|
8.21
|
263
|
0
|
29864
|
-472.05
|
27.24
|
| Exgal_CoaddM5 |
All sky g band |
26.46
|
25.41
|
5.95
|
271
|
0
|
33481
|
-355.90
|
28.89
|
| Exgal_CoaddM5 |
All sky r band |
26.68
|
25.81
|
4.42
|
268
|
0
|
33540
|
-255.77
|
28.93
|
| Exgal_CoaddM5 |
All sky i band |
26.25
|
25.53
|
3.38
|
268
|
0
|
33538
|
-188.67
|
28.56
|
| Exgal_CoaddM5 |
All sky z band |
25.61
|
24.97
|
2.66
|
268
|
0
|
33510
|
-141.09
|
28.07
|
| Exgal_CoaddM5 |
All sky y band |
24.71
|
24.20
|
2.33
|
261
|
0
|
29952
|
-112.44
|
26.62
|
Group: Extragalactic Coadded M5 Maps; Subgroup: WFD
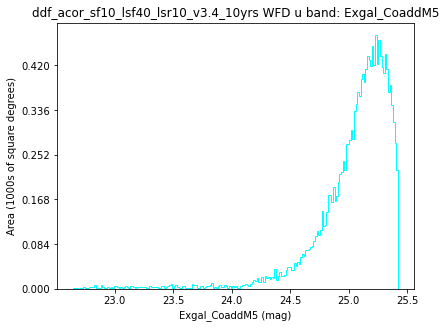
Exgal_CoaddM5
HealpixSubsetSlicer
WFD u band
Coadded depth per healpix for extragalactic purposes (i.e. combined with dust extinction maps), in WFD u band. More positive numbers indicate fainter limiting magnitudes.
Exgal_CoaddM5
HealpixSubsetSlicer
WFD g band
Coadded depth per healpix for extragalactic purposes (i.e. combined with dust extinction maps), in WFD g band. More positive numbers indicate fainter limiting magnitudes.
Exgal_CoaddM5
HealpixSubsetSlicer
WFD r band
Coadded depth per healpix for extragalactic purposes (i.e. combined with dust extinction maps), in WFD r band. More positive numbers indicate fainter limiting magnitudes.
Exgal_CoaddM5
HealpixSubsetSlicer
WFD i band
Coadded depth per healpix for extragalactic purposes (i.e. combined with dust extinction maps), in WFD i band. More positive numbers indicate fainter limiting magnitudes.
Exgal_CoaddM5
HealpixSubsetSlicer
WFD z band
Coadded depth per healpix for extragalactic purposes (i.e. combined with dust extinction maps), in WFD z band. More positive numbers indicate fainter limiting magnitudes.
Exgal_CoaddM5
HealpixSubsetSlicer
WFD y band
Coadded depth per healpix for extragalactic purposes (i.e. combined with dust extinction maps), in WFD y band. More positive numbers indicate fainter limiting magnitudes.
|
Group: Extragalactic Coadded M5 Maps; Subgroup: WFD; Slicer: HealpixSubsetSlicer
|
| Metric Name |
Info Label |
Median |
Mean |
Rms |
N(-3Sigma) |
N(+3Sigma) |
Count |
Min |
Max |
| Exgal_CoaddM5 |
WFD u band |
25.12
|
24.31
|
6.36
|
216
|
0
|
22469
|
-391.33
|
27.24
|
| Exgal_CoaddM5 |
WFD g band |
26.62
|
26.04
|
4.84
|
211
|
0
|
22469
|
-293.45
|
28.89
|
| Exgal_CoaddM5 |
WFD r band |
26.83
|
26.39
|
3.58
|
212
|
0
|
22469
|
-209.43
|
28.93
|
| Exgal_CoaddM5 |
WFD i band |
26.38
|
26.04
|
2.73
|
213
|
0
|
22469
|
-153.23
|
28.56
|
| Exgal_CoaddM5 |
WFD z band |
25.72
|
25.46
|
2.13
|
216
|
0
|
22469
|
-113.44
|
28.07
|
| Exgal_CoaddM5 |
WFD y band |
24.77
|
24.55
|
1.78
|
220
|
0
|
22469
|
-89.92
|
26.62
|
Group: Extragalactic Coadded M5 Maps; Subgroup: Yr 1
Exgal_CoaddM5
HealpixSlicer
Yr 1 u band
Coadded depth per healpix for extragalactic purposes (i.e. combined with dust extinction maps), in Yr 1 u band. More positive numbers indicate fainter limiting magnitudes.
Exgal_CoaddM5
HealpixSlicer
Yr 1 g band
Coadded depth per healpix for extragalactic purposes (i.e. combined with dust extinction maps), in Yr 1 g band. More positive numbers indicate fainter limiting magnitudes.
Exgal_CoaddM5
HealpixSlicer
Yr 1 r band
Coadded depth per healpix for extragalactic purposes (i.e. combined with dust extinction maps), in Yr 1 r band. More positive numbers indicate fainter limiting magnitudes.
Exgal_CoaddM5
HealpixSlicer
Yr 1 i band
Coadded depth per healpix for extragalactic purposes (i.e. combined with dust extinction maps), in Yr 1 i band. More positive numbers indicate fainter limiting magnitudes.
Exgal_CoaddM5
HealpixSlicer
Yr 1 z band
Coadded depth per healpix for extragalactic purposes (i.e. combined with dust extinction maps), in Yr 1 z band. More positive numbers indicate fainter limiting magnitudes.
Exgal_CoaddM5
HealpixSlicer
Yr 1 y band
Coadded depth per healpix for extragalactic purposes (i.e. combined with dust extinction maps), in Yr 1 y band. More positive numbers indicate fainter limiting magnitudes.
|
Group: Extragalactic Coadded M5 Maps; Subgroup: Yr 1; Slicer: HealpixSlicer
|
| Metric Name |
Info Label |
Median |
Mean |
Rms |
N(-3Sigma) |
N(+3Sigma) |
Count |
Min |
Max |
| Exgal_CoaddM5 |
Yr 1 u band |
23.88
|
22.64
|
8.18
|
260
|
0
|
29487
|
-472.85
|
26.52
|
| Exgal_CoaddM5 |
Yr 1 g band |
25.24
|
24.31
|
5.95
|
266
|
0
|
33183
|
-356.74
|
28.11
|
| Exgal_CoaddM5 |
Yr 1 r band |
25.51
|
24.69
|
4.42
|
265
|
0
|
33246
|
-256.85
|
28.16
|
| Exgal_CoaddM5 |
Yr 1 i band |
25.13
|
24.45
|
3.38
|
267
|
0
|
33311
|
-189.51
|
27.80
|
| Exgal_CoaddM5 |
Yr 1 z band |
24.42
|
23.85
|
2.65
|
268
|
0
|
33255
|
-141.90
|
27.31
|
| Exgal_CoaddM5 |
Yr 1 y band |
23.60
|
23.15
|
2.31
|
257
|
0
|
29670
|
-113.38
|
25.79
|
Group: Extragalactic Coadded M5 Maps; Subgroup: Yr 3-4
Exgal_CoaddM5
HealpixSlicer
Yr 3-4 u band
Coadded depth per healpix for extragalactic purposes (i.e. combined with dust extinction maps), in Yr 3-4 u band. More positive numbers indicate fainter limiting magnitudes.
Exgal_CoaddM5
HealpixSlicer
Yr 3-4 g band
Coadded depth per healpix for extragalactic purposes (i.e. combined with dust extinction maps), in Yr 3-4 g band. More positive numbers indicate fainter limiting magnitudes.
Exgal_CoaddM5
HealpixSlicer
Yr 3-4 r band
Coadded depth per healpix for extragalactic purposes (i.e. combined with dust extinction maps), in Yr 3-4 r band. More positive numbers indicate fainter limiting magnitudes.
Exgal_CoaddM5
HealpixSlicer
Yr 3-4 i band
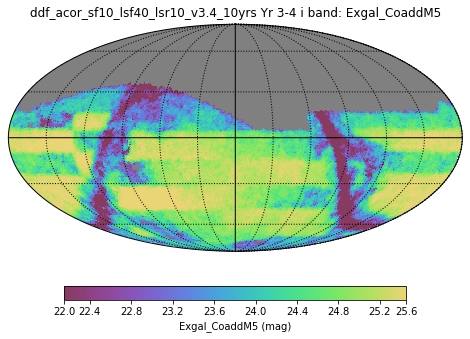
Coadded depth per healpix for extragalactic purposes (i.e. combined with dust extinction maps), in Yr 3-4 i band. More positive numbers indicate fainter limiting magnitudes.
Exgal_CoaddM5
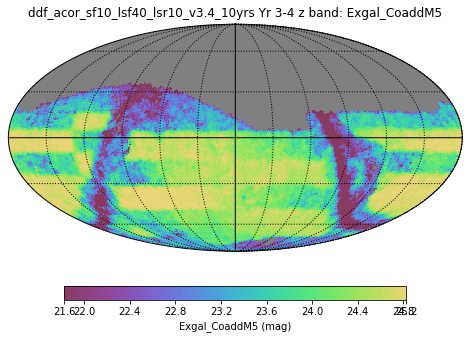
HealpixSlicer
Yr 3-4 z band
Coadded depth per healpix for extragalactic purposes (i.e. combined with dust extinction maps), in Yr 3-4 z band. More positive numbers indicate fainter limiting magnitudes.
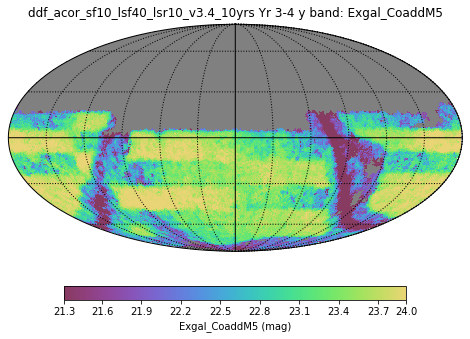
Exgal_CoaddM5
HealpixSlicer
Yr 3-4 y band
Coadded depth per healpix for extragalactic purposes (i.e. combined with dust extinction maps), in Yr 3-4 y band. More positive numbers indicate fainter limiting magnitudes.
|
Group: Extragalactic Coadded M5 Maps; Subgroup: Yr 3-4; Slicer: HealpixSlicer
|
| Metric Name |
Info Label |
Median |
Mean |
Rms |
N(-3Sigma) |
N(+3Sigma) |
Count |
Min |
Max |
| Exgal_CoaddM5 |
Yr 3-4 u band |
23.53
|
22.47
|
6.20
|
280
|
0
|
25293
|
-180.57
|
24.72
|
| Exgal_CoaddM5 |
Yr 3-4 g band |
24.91
|
24.02
|
5.79
|
259
|
0
|
31207
|
-356.97
|
26.29
|
| Exgal_CoaddM5 |
Yr 3-4 r band |
25.09
|
24.41
|
4.45
|
265
|
0
|
32828
|
-257.16
|
26.33
|
| Exgal_CoaddM5 |
Yr 3-4 i band |
24.62
|
24.11
|
3.61
|
253
|
0
|
33071
|
-190.17
|
25.87
|
| Exgal_CoaddM5 |
Yr 3-4 z band |
24.04
|
23.61
|
3.00
|
239
|
0
|
32970
|
-142.34
|
25.22
|
| Exgal_CoaddM5 |
Yr 3-4 y band |
23.29
|
22.89
|
2.30
|
256
|
0
|
29027
|
-113.29
|
24.27
|
Group: Filter Changes; Subgroup: Per Night
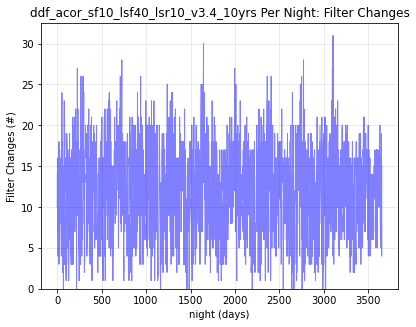
Filter Changes
OneDSlicer
Per Night
Total filter changes per night.
Max number of filter changes within 10.0 minutes
OneDSlicer
Per Night
Max number of filter changes within a window of 10 minutes per night.
Max number of filter changes within 20.0 minutes
OneDSlicer
Per Night
Max number of filter changes within a window of 20 minutes per night.
Minimum time between filter changes (minutes)
OneDSlicer
Per Night
Minimum time between filter changes per night.
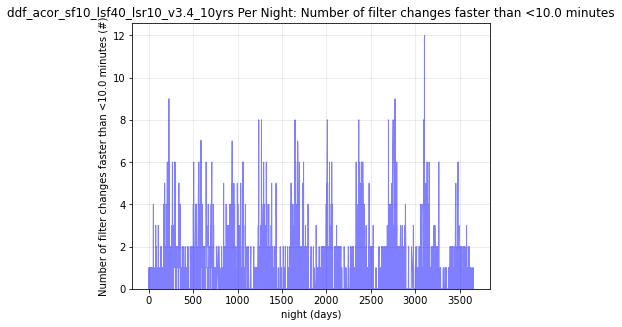
Number of filter changes faster than <10.0 minutes
OneDSlicer
Per Night
Number of filter changes faster than 10 minutes per night.
Number of filter changes faster than <20.0 minutes
OneDSlicer
Per Night
Number of filter changes faster than 20 minutes per night.
|
Group: Filter Changes; Subgroup: Per Night; Slicer: OneDSlicer
|
| Metric Name |
Info Label |
Median |
Mean |
Rms |
N(-3Sigma) |
N(+3Sigma) |
Count |
Min |
Max |
| Filter Changes |
Per Night |
13.00
|
12.31
|
4.97
|
0
|
4
|
2808
|
0.0000
|
31.00
|
| Max number of filter changes within 10.0 minutes |
Per Night |
1.00
|
1.39
|
0.51
|
0
|
15
|
2808
|
0.0000
|
3.00
|
| Max number of filter changes within 20.0 minutes |
Per Night |
2.00
|
1.73
|
0.56
|
12
|
15
|
2808
|
0.0000
|
4.00
|
| Minimum time between filter changes (minutes) |
Per Night |
15.49
|
15.44
|
12.11
|
0
|
19
|
2796
|
2.57
|
315.56
|
| Number of filter changes faster than <10.0 minutes |
Per Night |
0.0000
|
0.81
|
1.33
|
0
|
76
|
2808
|
0.0000
|
12.00
|
| Number of filter changes faster than <20.0 minutes |
Per Night |
2.00
|
3.71
|
3.80
|
0
|
42
|
2808
|
0.0000
|
24.00
|
Group: Filter Changes; Subgroup: Whole Survey
|
Group: Filter Changes; Subgroup: Whole Survey; Slicer: UniSlicer
|
| |
Filter Changes |
Max number of filter changes within 10.0 minutes |
Max number of filter changes within 20.0 minutes |
Minimum time between filter changes (minutes) |
Number of filter changes faster than <10.0 minutes |
Number of filter changes faster than <20.0 minutes |
| Whole Survey |
36539.00
|
3.00
|
4.00
|
2.57
|
2272.00
|
9888.00
|
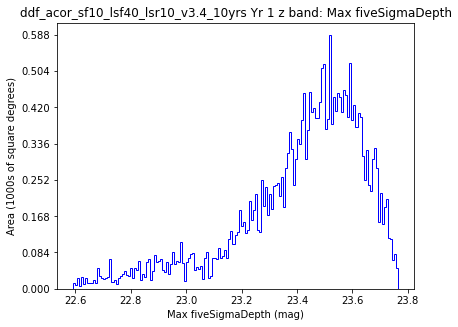
Group: Fivesigmadepth; Subgroup: All sky
Max fiveSigmaDepth
HealpixSlicer
All sky all bands
Map of Max fiveSigmaDepth for All sky all bands.
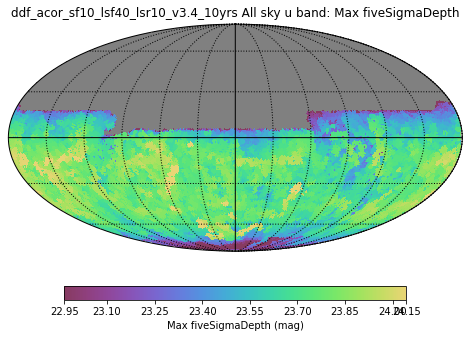
Max fiveSigmaDepth
HealpixSlicer
All sky u band
Map of Max fiveSigmaDepth for All sky u band.
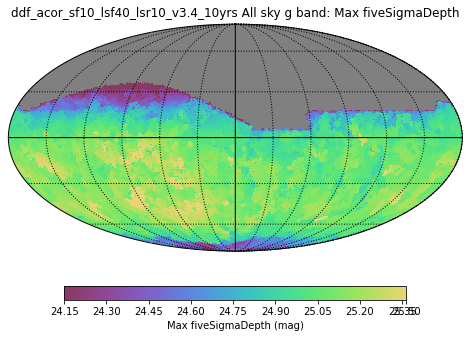
Max fiveSigmaDepth
HealpixSlicer
All sky g band
Map of Max fiveSigmaDepth for All sky g band.
Max fiveSigmaDepth
HealpixSlicer
All sky r band
Map of Max fiveSigmaDepth for All sky r band.
Max fiveSigmaDepth
HealpixSlicer
All sky i band
Map of Max fiveSigmaDepth for All sky i band.
Max fiveSigmaDepth
HealpixSlicer
All sky z band
Map of Max fiveSigmaDepth for All sky z band.
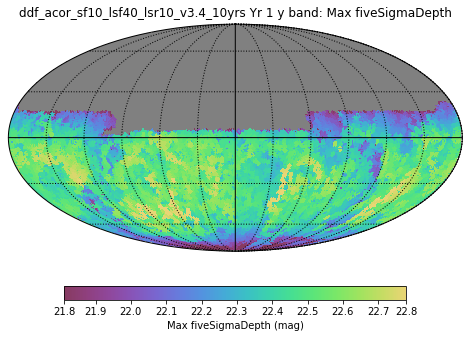
Max fiveSigmaDepth
HealpixSlicer
All sky y band
Map of Max fiveSigmaDepth for All sky y band.
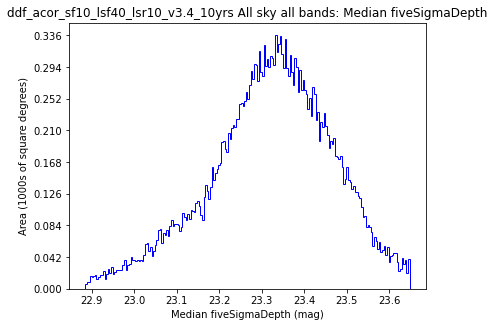
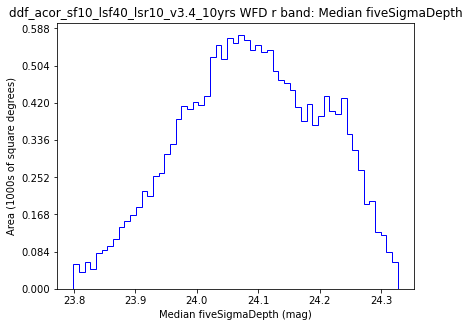
Median fiveSigmaDepth
HealpixSlicer
All sky all bands
Map of Median fiveSigmaDepth for All sky all bands.
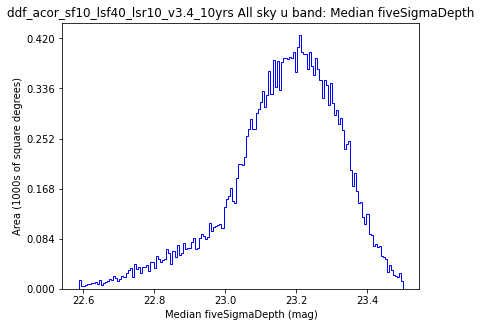
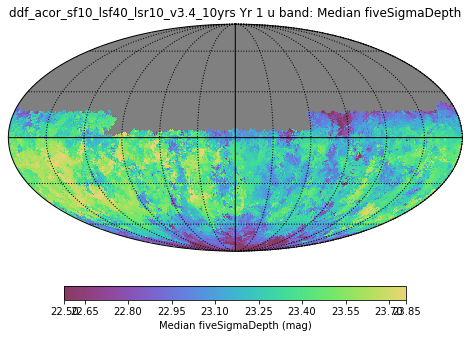
Median fiveSigmaDepth
HealpixSlicer
All sky u band
Map of Median fiveSigmaDepth for All sky u band.
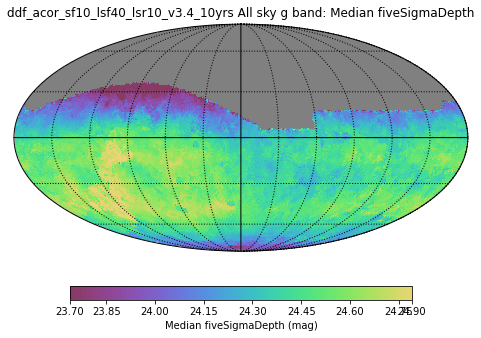
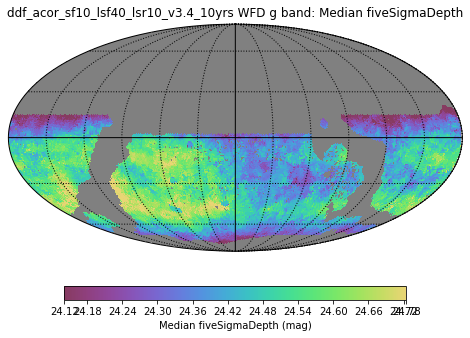
Median fiveSigmaDepth
HealpixSlicer
All sky g band
Map of Median fiveSigmaDepth for All sky g band.
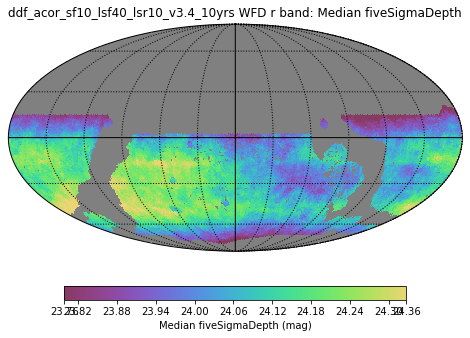
Median fiveSigmaDepth
HealpixSlicer
All sky r band
Map of Median fiveSigmaDepth for All sky r band.
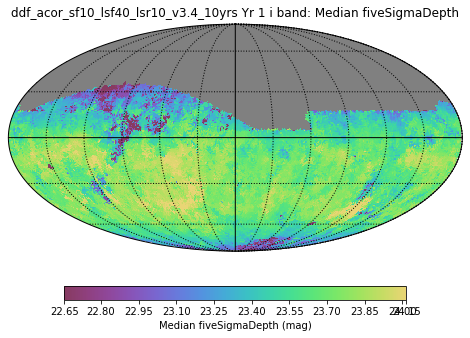
Median fiveSigmaDepth
HealpixSlicer
All sky i band
Map of Median fiveSigmaDepth for All sky i band.
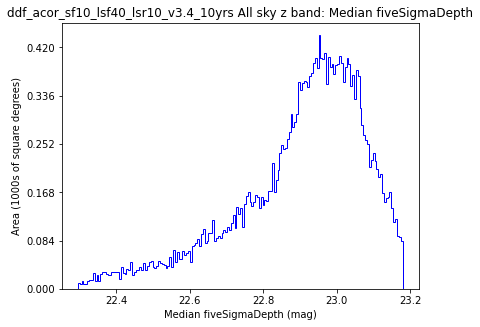
Median fiveSigmaDepth
HealpixSlicer
All sky z band
Map of Median fiveSigmaDepth for All sky z band.
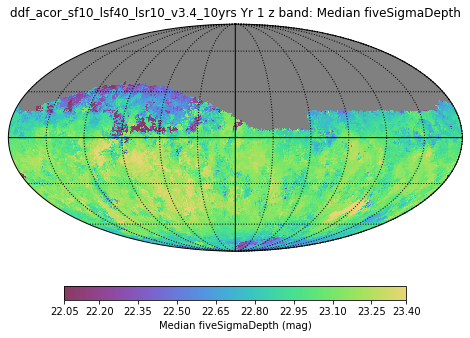
Median fiveSigmaDepth
HealpixSlicer
All sky y band
Map of Median fiveSigmaDepth for All sky y band.
Min fiveSigmaDepth
HealpixSlicer
All sky all bands
Map of Min fiveSigmaDepth for All sky all bands.
Min fiveSigmaDepth
HealpixSlicer
All sky u band
Map of Min fiveSigmaDepth for All sky u band.
Min fiveSigmaDepth
HealpixSlicer
All sky g band
Map of Min fiveSigmaDepth for All sky g band.
Min fiveSigmaDepth
HealpixSlicer
All sky r band
Map of Min fiveSigmaDepth for All sky r band.
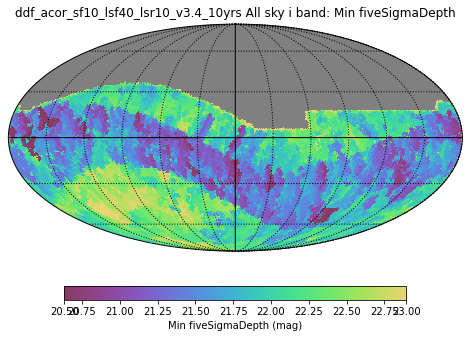
Min fiveSigmaDepth
HealpixSlicer
All sky i band
Map of Min fiveSigmaDepth for All sky i band.
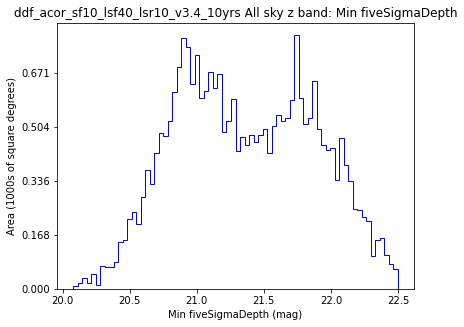
Min fiveSigmaDepth
HealpixSlicer
All sky z band
Map of Min fiveSigmaDepth for All sky z band.
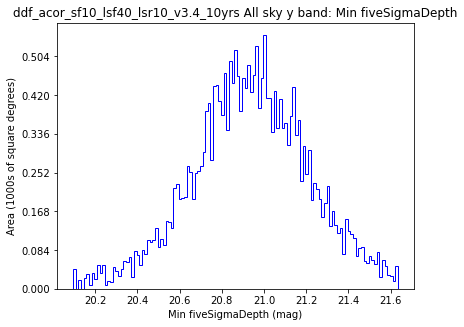
Min fiveSigmaDepth
HealpixSlicer
All sky y band
Map of Min fiveSigmaDepth for All sky y band.
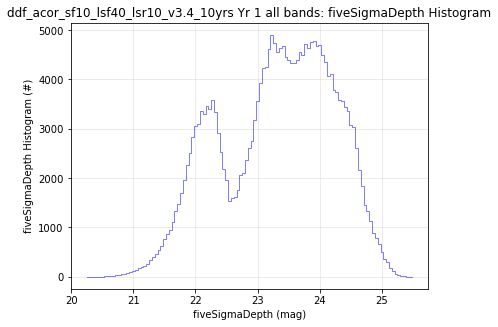
fiveSigmaDepth Histogram
OneDSlicer
All sky all bands
Histogram of fiveSigmaDepth for All sky all bands.
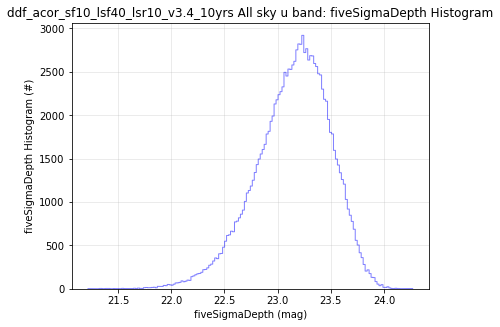
fiveSigmaDepth Histogram
OneDSlicer
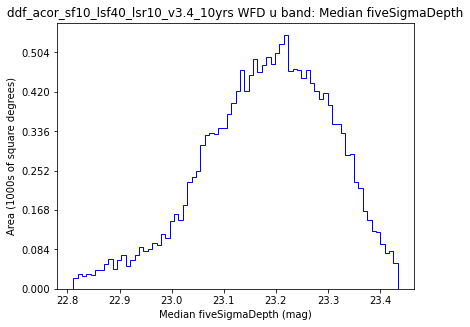
All sky u band
Histogram of fiveSigmaDepth for All sky u band.
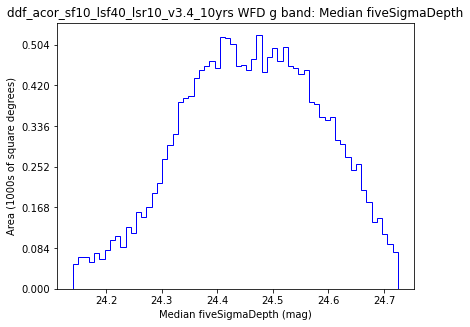
fiveSigmaDepth Histogram
OneDSlicer
All sky g band
Histogram of fiveSigmaDepth for All sky g band.
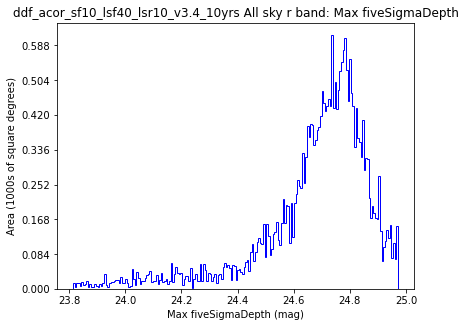
fiveSigmaDepth Histogram
OneDSlicer
All sky r band
Histogram of fiveSigmaDepth for All sky r band.
fiveSigmaDepth Histogram
OneDSlicer
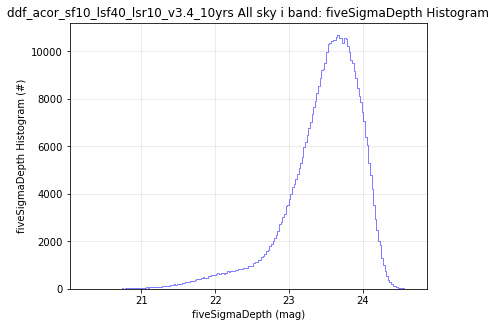
All sky i band
Histogram of fiveSigmaDepth for All sky i band.
fiveSigmaDepth Histogram
OneDSlicer
All sky z band
Histogram of fiveSigmaDepth for All sky z band.
fiveSigmaDepth Histogram
OneDSlicer
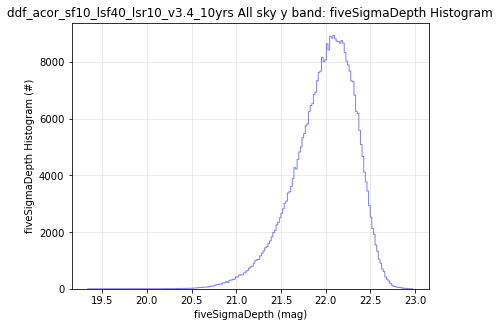
All sky y band
Histogram of fiveSigmaDepth for All sky y band.
|
Group: Fivesigmadepth; Subgroup: All sky; Slicer: HealpixSlicer
|
| Metric Name |
Info Label |
Median |
Mean |
Rms |
N(-3Sigma) |
N(+3Sigma) |
Count |
Min |
Max |
| Max fiveSigmaDepth |
All sky all bands |
25.07
|
25.01
|
0.25
|
639
|
0
|
33578
|
21.84
|
25.48
|
| Median fiveSigmaDepth |
All sky all bands |
23.33
|
23.32
|
0.16
|
225
|
19
|
33578
|
21.76
|
24.30
|
| Min fiveSigmaDepth |
All sky all bands |
20.88
|
20.92
|
0.40
|
65
|
212
|
33578
|
19.34
|
24.14
|
| Max fiveSigmaDepth |
All sky u band |
23.73
|
23.69
|
0.21
|
551
|
0
|
29864
|
21.70
|
24.27
|
| Median fiveSigmaDepth |
All sky u band |
23.18
|
23.16
|
0.18
|
367
|
16
|
29864
|
21.70
|
23.78
|
| Min fiveSigmaDepth |
All sky u band |
22.36
|
22.35
|
0.30
|
198
|
59
|
29864
|
21.22
|
23.78
|
| Max fiveSigmaDepth |
All sky g band |
25.07
|
25.01
|
0.24
|
742
|
0
|
33481
|
22.42
|
25.48
|
| Median fiveSigmaDepth |
All sky g band |
24.43
|
24.40
|
0.22
|
397
|
0
|
33481
|
22.42
|
24.95
|
| Min fiveSigmaDepth |
All sky g band |
23.27
|
23.23
|
0.39
|
76
|
13
|
33481
|
21.78
|
24.75
|
| Max fiveSigmaDepth |
All sky r band |
24.72
|
24.67
|
0.23
|
783
|
0
|
33540
|
22.49
|
25.03
|
| Median fiveSigmaDepth |
All sky r band |
24.05
|
24.02
|
0.19
|
518
|
0
|
33540
|
22.49
|
24.41
|
| Min fiveSigmaDepth |
All sky r band |
22.52
|
22.48
|
0.50
|
107
|
13
|
33540
|
20.80
|
24.35
|
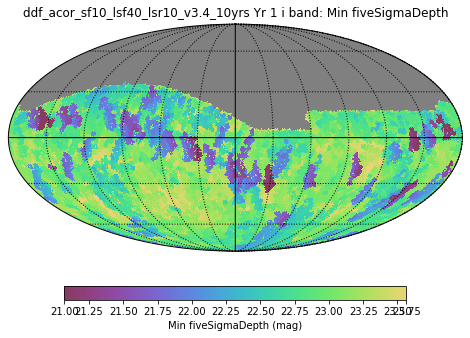
| Max fiveSigmaDepth |
All sky i band |
24.24
|
24.18
|
0.23
|
703
|
0
|
33538
|
22.19
|
24.64
|
| Median fiveSigmaDepth |
All sky i band |
23.55
|
23.50
|
0.20
|
439
|
0
|
33538
|
22.19
|
23.94
|
| Min fiveSigmaDepth |
All sky i band |
21.82
|
21.81
|
0.53
|
0
|
23
|
33538
|
20.25
|
23.94
|
| Max fiveSigmaDepth |
All sky z band |
23.59
|
23.53
|
0.23
|
546
|
0
|
33510
|
21.07
|
23.97
|
| Median fiveSigmaDepth |
All sky z band |
22.94
|
22.90
|
0.19
|
410
|
0
|
33510
|
21.04
|
23.42
|
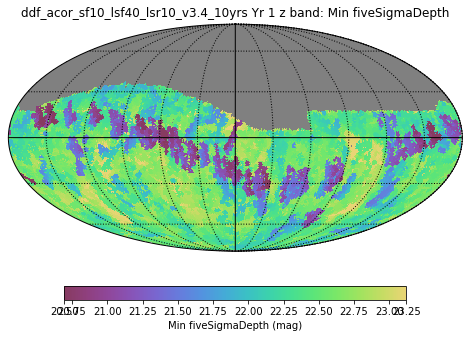
| Min fiveSigmaDepth |
All sky z band |
21.33
|
21.36
|
0.54
|
35
|
4
|
33510
|
19.64
|
23.42
|
| Max fiveSigmaDepth |
All sky y band |
22.60
|
22.56
|
0.17
|
581
|
0
|
29952
|
20.71
|
22.97
|
| Median fiveSigmaDepth |
All sky y band |
22.03
|
22.00
|
0.14
|
330
|
0
|
29952
|
20.71
|
22.37
|
| Min fiveSigmaDepth |
All sky y band |
20.93
|
20.93
|
0.30
|
215
|
34
|
29952
|
19.34
|
22.28
|
|
Group: Fivesigmadepth; Subgroup: All sky; Slicer: UniSlicer
|
| |
25th%ile fiveSigmaDepth |
75th%ile fiveSigmaDepth |
Count fiveSigmaDepth |
Max fiveSigmaDepth |
Mean fiveSigmaDepth |
Median fiveSigmaDepth |
Min fiveSigmaDepth |
N(+3Sigma) fiveSigmaDepth |
N(-3Sigma) fiveSigmaDepth |
Rms fiveSigmaDepth |
| All sky all bands |
22.60
|
23.94
|
2147095
|
25.48
|
23.25
|
23.34
|
19.34
|
0
|
763
|
0.89
|
| All sky g band |
24.12
|
24.70
|
196987
|
25.48
|
24.38
|
24.42
|
21.78
|
0
|
1940
|
0.45
|
| All sky i band |
23.23
|
23.82
|
500895
|
24.64
|
23.46
|
23.56
|
20.25
|
0
|
8923
|
0.52
|
| All sky r band |
23.75
|
24.32
|
489465
|
25.03
|
23.98
|
24.06
|
20.80
|
0
|
9165
|
0.49
|
| All sky u band |
22.93
|
23.39
|
124477
|
24.27
|
23.14
|
23.18
|
21.22
|
9
|
734
|
0.35
|
| All sky y band |
21.78
|
22.23
|
394073
|
22.97
|
21.98
|
22.03
|
19.34
|
0
|
2987
|
0.35
|
| All sky z band |
22.67
|
23.20
|
441198
|
23.97
|
22.87
|
22.96
|
19.64
|
0
|
8393
|
0.48
|
Group: Fivesigmadepth; Subgroup: WFD
Max fiveSigmaDepth
HealpixSubsetSlicer
WFD all bands
Map of Max fiveSigmaDepth for WFD all bands.
Max fiveSigmaDepth
HealpixSubsetSlicer
WFD u band
Map of Max fiveSigmaDepth for WFD u band.
Max fiveSigmaDepth
HealpixSubsetSlicer
WFD g band
Map of Max fiveSigmaDepth for WFD g band.
Max fiveSigmaDepth
HealpixSubsetSlicer
WFD r band
Map of Max fiveSigmaDepth for WFD r band.
Max fiveSigmaDepth
HealpixSubsetSlicer
WFD i band
Map of Max fiveSigmaDepth for WFD i band.
Max fiveSigmaDepth
HealpixSubsetSlicer
WFD z band
Map of Max fiveSigmaDepth for WFD z band.
Max fiveSigmaDepth
HealpixSubsetSlicer
WFD y band
Map of Max fiveSigmaDepth for WFD y band.
Median fiveSigmaDepth
HealpixSubsetSlicer
WFD all bands
Map of Median fiveSigmaDepth for WFD all bands.
Median fiveSigmaDepth
HealpixSubsetSlicer
WFD u band
Map of Median fiveSigmaDepth for WFD u band.
Median fiveSigmaDepth
HealpixSubsetSlicer
WFD g band
Map of Median fiveSigmaDepth for WFD g band.
Median fiveSigmaDepth
HealpixSubsetSlicer
WFD r band
Map of Median fiveSigmaDepth for WFD r band.
Median fiveSigmaDepth
HealpixSubsetSlicer
WFD i band
Map of Median fiveSigmaDepth for WFD i band.
Median fiveSigmaDepth
HealpixSubsetSlicer
WFD z band
Map of Median fiveSigmaDepth for WFD z band.
Median fiveSigmaDepth
HealpixSubsetSlicer
WFD y band
Map of Median fiveSigmaDepth for WFD y band.
Min fiveSigmaDepth
HealpixSubsetSlicer
WFD all bands
Map of Min fiveSigmaDepth for WFD all bands.
Min fiveSigmaDepth
HealpixSubsetSlicer
WFD u band
Map of Min fiveSigmaDepth for WFD u band.
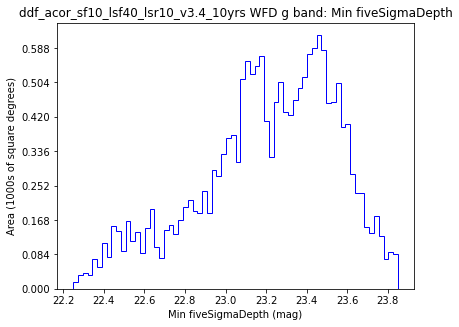
Min fiveSigmaDepth
HealpixSubsetSlicer
WFD g band
Map of Min fiveSigmaDepth for WFD g band.
Min fiveSigmaDepth
HealpixSubsetSlicer
WFD r band
Map of Min fiveSigmaDepth for WFD r band.
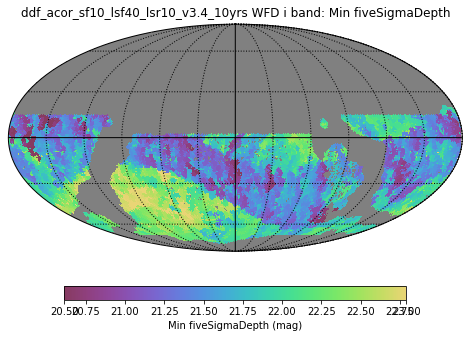
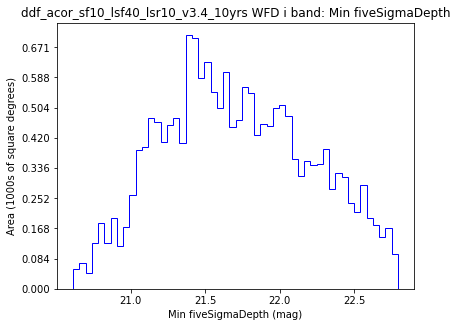
Min fiveSigmaDepth
HealpixSubsetSlicer
WFD i band
Map of Min fiveSigmaDepth for WFD i band.
Min fiveSigmaDepth
HealpixSubsetSlicer
WFD z band
Map of Min fiveSigmaDepth for WFD z band.
Min fiveSigmaDepth
HealpixSubsetSlicer
WFD y band
Map of Min fiveSigmaDepth for WFD y band.
fiveSigmaDepth Histogram
OneDSlicer
WFD all bands
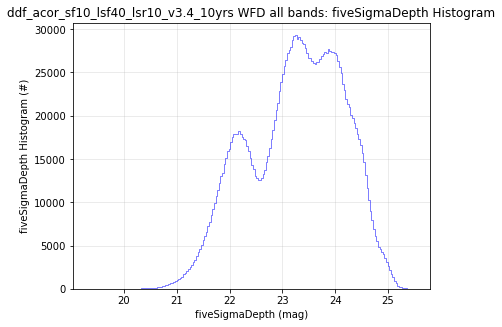
Histogram of fiveSigmaDepth for WFD all bands.
fiveSigmaDepth Histogram
OneDSlicer
WFD u band
Histogram of fiveSigmaDepth for WFD u band.
fiveSigmaDepth Histogram
OneDSlicer
WFD g band
Histogram of fiveSigmaDepth for WFD g band.
fiveSigmaDepth Histogram
OneDSlicer
WFD r band
Histogram of fiveSigmaDepth for WFD r band.
fiveSigmaDepth Histogram
OneDSlicer
WFD i band
Histogram of fiveSigmaDepth for WFD i band.
fiveSigmaDepth Histogram
OneDSlicer
WFD z band
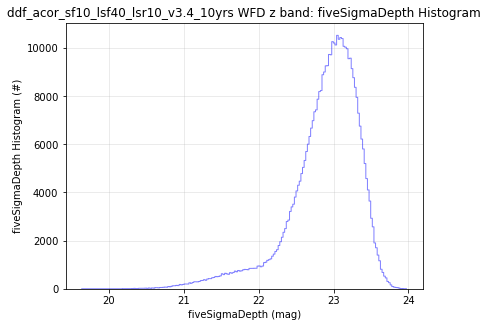
Histogram of fiveSigmaDepth for WFD z band.
fiveSigmaDepth Histogram
OneDSlicer
WFD y band
Histogram of fiveSigmaDepth for WFD y band.
|
Group: Fivesigmadepth; Subgroup: WFD; Slicer: HealpixSubsetSlicer
|
| Metric Name |
Info Label |
Median |
Mean |
Rms |
N(-3Sigma) |
N(+3Sigma) |
Count |
Min |
Max |
| Max fiveSigmaDepth |
WFD all bands |
25.10
|
25.10
|
0.12
|
83
|
32
|
22469
|
24.55
|
25.48
|
| Median fiveSigmaDepth |
WFD all bands |
23.33
|
23.33
|
0.12
|
26
|
8
|
22469
|
22.90
|
23.73
|
| Min fiveSigmaDepth |
WFD all bands |
20.82
|
20.79
|
0.29
|
205
|
0
|
22469
|
19.34
|
21.61
|
| Max fiveSigmaDepth |
WFD u band |
23.75
|
23.74
|
0.15
|
56
|
101
|
22469
|
23.10
|
24.27
|
| Median fiveSigmaDepth |
WFD u band |
23.19
|
23.18
|
0.13
|
152
|
1
|
22469
|
22.67
|
23.58
|
| Min fiveSigmaDepth |
WFD u band |
22.33
|
22.30
|
0.25
|
234
|
1
|
22469
|
21.22
|
23.07
|
| Max fiveSigmaDepth |
WFD g band |
25.10
|
25.10
|
0.12
|
86
|
32
|
22469
|
24.55
|
25.48
|
| Median fiveSigmaDepth |
WFD g band |
24.46
|
24.46
|
0.13
|
18
|
0
|
22469
|
24.00
|
24.82
|
| Min fiveSigmaDepth |
WFD g band |
23.25
|
23.20
|
0.36
|
94
|
0
|
22469
|
21.78
|
24.07
|
| Max fiveSigmaDepth |
WFD r band |
24.76
|
24.75
|
0.11
|
52
|
0
|
22469
|
24.32
|
25.03
|
| Median fiveSigmaDepth |
WFD r band |
24.09
|
24.09
|
0.12
|
14
|
0
|
22469
|
23.70
|
24.41
|
| Min fiveSigmaDepth |
WFD r band |
22.43
|
22.41
|
0.47
|
105
|
0
|
22469
|
20.80
|
23.43
|
| Max fiveSigmaDepth |
WFD i band |
24.28
|
24.27
|
0.11
|
70
|
36
|
22469
|
23.84
|
24.64
|
| Median fiveSigmaDepth |
WFD i band |
23.58
|
23.58
|
0.12
|
70
|
0
|
22469
|
23.16
|
23.86
|
| Min fiveSigmaDepth |
WFD i band |
21.68
|
21.71
|
0.52
|
0
|
0
|
22469
|
20.25
|
22.99
|
| Max fiveSigmaDepth |
WFD z band |
23.63
|
23.62
|
0.11
|
106
|
13
|
22469
|
23.18
|
23.97
|
| Median fiveSigmaDepth |
WFD z band |
22.98
|
22.97
|
0.11
|
85
|
1
|
22469
|
22.57
|
23.31
|
| Min fiveSigmaDepth |
WFD z band |
21.20
|
21.26
|
0.50
|
45
|
0
|
22469
|
19.64
|
22.49
|
| Max fiveSigmaDepth |
WFD y band |
22.62
|
22.61
|
0.12
|
133
|
10
|
22469
|
22.08
|
22.97
|
| Median fiveSigmaDepth |
WFD y band |
22.04
|
22.03
|
0.11
|
170
|
0
|
22469
|
21.53
|
22.29
|
| Min fiveSigmaDepth |
WFD y band |
20.90
|
20.88
|
0.27
|
205
|
0
|
22469
|
19.34
|
21.61
|
|
Group: Fivesigmadepth; Subgroup: WFD; Slicer: UniSlicer
|
| |
25th%ile fiveSigmaDepth |
75th%ile fiveSigmaDepth |
Count fiveSigmaDepth |
Max fiveSigmaDepth |
Mean fiveSigmaDepth |
Median fiveSigmaDepth |
Min fiveSigmaDepth |
N(+3Sigma) fiveSigmaDepth |
N(-3Sigma) fiveSigmaDepth |
Rms fiveSigmaDepth |
| WFD all bands |
22.60
|
23.94
|
2147095
|
25.48
|
23.25
|
23.34
|
19.34
|
0
|
763
|
0.89
|
| WFD g band |
24.12
|
24.70
|
196987
|
25.48
|
24.38
|
24.42
|
21.78
|
0
|
1940
|
0.45
|
| WFD i band |
23.23
|
23.82
|
500895
|
24.64
|
23.46
|
23.56
|
20.25
|
0
|
8923
|
0.52
|
| WFD r band |
23.75
|
24.32
|
489465
|
25.03
|
23.98
|
24.06
|
20.80
|
0
|
9165
|
0.49
|
| WFD u band |
22.93
|
23.39
|
124477
|
24.27
|
23.14
|
23.18
|
21.22
|
9
|
734
|
0.35
|
| WFD y band |
21.78
|
22.23
|
394073
|
22.97
|
21.98
|
22.03
|
19.34
|
0
|
2987
|
0.35
|
| WFD z band |
22.67
|
23.20
|
441198
|
23.97
|
22.87
|
22.96
|
19.64
|
0
|
8393
|
0.48
|
Group: Fivesigmadepth; Subgroup: Yr 1
Max fiveSigmaDepth
HealpixSlicer
Yr 1 all bands
Map of Max fiveSigmaDepth for Yr 1 all bands.
Max fiveSigmaDepth
HealpixSlicer
Yr 1 u band
Map of Max fiveSigmaDepth for Yr 1 u band.
Max fiveSigmaDepth
HealpixSlicer
Yr 1 g band
Map of Max fiveSigmaDepth for Yr 1 g band.
Max fiveSigmaDepth
HealpixSlicer
Yr 1 r band
Map of Max fiveSigmaDepth for Yr 1 r band.
Max fiveSigmaDepth
HealpixSlicer
Yr 1 i band
Map of Max fiveSigmaDepth for Yr 1 i band.
Max fiveSigmaDepth
HealpixSlicer
Yr 1 z band
Map of Max fiveSigmaDepth for Yr 1 z band.
Max fiveSigmaDepth
HealpixSlicer
Yr 1 y band
Map of Max fiveSigmaDepth for Yr 1 y band.
Median fiveSigmaDepth
HealpixSlicer
Yr 1 all bands
Map of Median fiveSigmaDepth for Yr 1 all bands.
Median fiveSigmaDepth
HealpixSlicer
Yr 1 u band
Map of Median fiveSigmaDepth for Yr 1 u band.
Median fiveSigmaDepth
HealpixSlicer
Yr 1 g band
Map of Median fiveSigmaDepth for Yr 1 g band.
Median fiveSigmaDepth
HealpixSlicer
Yr 1 r band
Map of Median fiveSigmaDepth for Yr 1 r band.
Median fiveSigmaDepth
HealpixSlicer
Yr 1 i band
Map of Median fiveSigmaDepth for Yr 1 i band.
Median fiveSigmaDepth
HealpixSlicer
Yr 1 z band
Map of Median fiveSigmaDepth for Yr 1 z band.
Median fiveSigmaDepth
HealpixSlicer
Yr 1 y band
Map of Median fiveSigmaDepth for Yr 1 y band.
Min fiveSigmaDepth
HealpixSlicer
Yr 1 all bands
Map of Min fiveSigmaDepth for Yr 1 all bands.
Min fiveSigmaDepth
HealpixSlicer
Yr 1 u band
Map of Min fiveSigmaDepth for Yr 1 u band.
Min fiveSigmaDepth
HealpixSlicer
Yr 1 g band
Map of Min fiveSigmaDepth for Yr 1 g band.
Min fiveSigmaDepth
HealpixSlicer
Yr 1 r band
Map of Min fiveSigmaDepth for Yr 1 r band.
Min fiveSigmaDepth
HealpixSlicer
Yr 1 i band
Map of Min fiveSigmaDepth for Yr 1 i band.
Min fiveSigmaDepth
HealpixSlicer
Yr 1 z band
Map of Min fiveSigmaDepth for Yr 1 z band.
Min fiveSigmaDepth
HealpixSlicer
Yr 1 y band
Map of Min fiveSigmaDepth for Yr 1 y band.
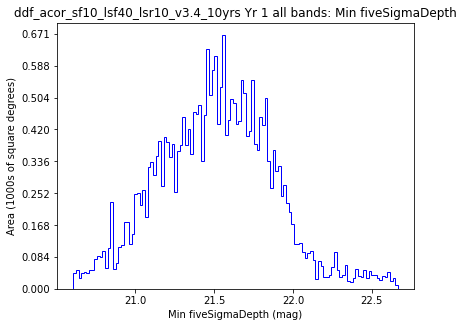
fiveSigmaDepth Histogram
OneDSlicer
Yr 1 all bands
Histogram of fiveSigmaDepth for Yr 1 all bands.
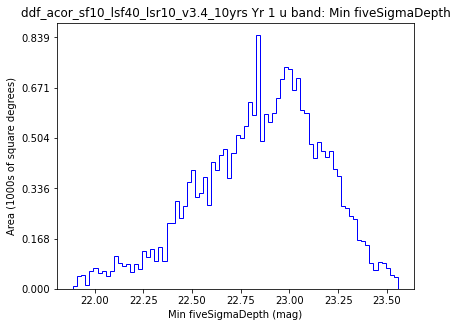
fiveSigmaDepth Histogram
OneDSlicer
Yr 1 u band
Histogram of fiveSigmaDepth for Yr 1 u band.
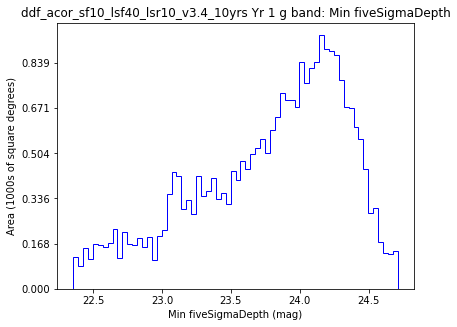
fiveSigmaDepth Histogram
OneDSlicer
Yr 1 g band
Histogram of fiveSigmaDepth for Yr 1 g band.
fiveSigmaDepth Histogram
OneDSlicer
Yr 1 r band
Histogram of fiveSigmaDepth for Yr 1 r band.
fiveSigmaDepth Histogram
OneDSlicer
Yr 1 i band
Histogram of fiveSigmaDepth for Yr 1 i band.
fiveSigmaDepth Histogram
OneDSlicer
Yr 1 z band
Histogram of fiveSigmaDepth for Yr 1 z band.
fiveSigmaDepth Histogram
OneDSlicer
Yr 1 y band
Histogram of fiveSigmaDepth for Yr 1 y band.
|
Group: Fivesigmadepth; Subgroup: Yr 1; Slicer: HealpixSlicer
|
| Metric Name |
Info Label |
Median |
Mean |
Rms |
N(-3Sigma) |
N(+3Sigma) |
Count |
Min |
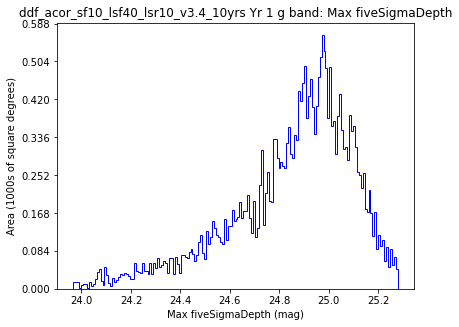
Max |
| Max fiveSigmaDepth |
Yr 1 all bands |
24.90
|
24.84
|
0.29
|
438
|
0
|
33393
|
21.07
|
25.48
|
| Median fiveSigmaDepth |
Yr 1 all bands |
23.41
|
23.40
|
0.23
|
264
|
46
|
33393
|
21.04
|
24.56
|
| Min fiveSigmaDepth |
Yr 1 all bands |
21.51
|
21.52
|
0.41
|
9
|
269
|
33393
|
20.25
|
24.13
|
| Max fiveSigmaDepth |
Yr 1 u band |
23.62
|
23.58
|
0.25
|
300
|
0
|
29487
|
22.06
|
24.13
|
| Median fiveSigmaDepth |
Yr 1 u band |
23.29
|
23.28
|
0.25
|
195
|
0
|
29487
|
22.06
|
23.92
|
| Min fiveSigmaDepth |
Yr 1 u band |
22.89
|
22.85
|
0.34
|
168
|
1
|
29487
|
21.59
|
23.89
|
| Max fiveSigmaDepth |
Yr 1 g band |
24.90
|
24.84
|
0.29
|
368
|
0
|
33183
|
22.25
|
25.48
|
| Median fiveSigmaDepth |
Yr 1 g band |
24.49
|
24.45
|
0.30
|
450
|
0
|
33183
|
22.12
|
25.30
|
| Min fiveSigmaDepth |
Yr 1 g band |
23.90
|
23.77
|
0.57
|
43
|
0
|
33183
|
21.78
|
25.15
|
| Max fiveSigmaDepth |
Yr 1 r band |
24.62
|
24.56
|
0.26
|
681
|
0
|
33246
|
22.21
|
24.98
|
| Median fiveSigmaDepth |
Yr 1 r band |
24.17
|
24.12
|
0.29
|
528
|
0
|
33246
|
21.97
|
24.78
|
| Min fiveSigmaDepth |
Yr 1 r band |
23.32
|
23.22
|
0.55
|
33
|
0
|
33246
|
21.30
|
24.63
|
| Max fiveSigmaDepth |
Yr 1 i band |
24.13
|
24.06
|
0.26
|
480
|
0
|
33311
|
22.01
|
24.63
|
| Median fiveSigmaDepth |
Yr 1 i band |
23.67
|
23.61
|
0.27
|
584
|
0
|
33311
|
21.61
|
24.20
|
| Min fiveSigmaDepth |
Yr 1 i band |
22.89
|
22.75
|
0.55
|
355
|
0
|
33311
|
20.25
|
24.15
|
| Max fiveSigmaDepth |
Yr 1 z band |
23.46
|
23.40
|
0.26
|
429
|
0
|
33255
|
21.07
|
23.89
|
| Median fiveSigmaDepth |
Yr 1 z band |
23.06
|
23.00
|
0.26
|
521
|
0
|
33255
|
20.93
|
23.73
|
| Min fiveSigmaDepth |
Yr 1 z band |
22.41
|
22.26
|
0.57
|
95
|
0
|
33255
|
20.38
|
23.59
|
| Max fiveSigmaDepth |
Yr 1 y band |
22.45
|
22.42
|
0.20
|
337
|
0
|
29670
|
20.99
|
22.86
|
| Median fiveSigmaDepth |
Yr 1 y band |
22.10
|
22.07
|
0.17
|
244
|
0
|
29670
|
20.96
|
22.58
|
| Min fiveSigmaDepth |
Yr 1 y band |
21.54
|
21.52
|
0.29
|
155
|
7
|
29670
|
20.43
|
22.45
|
|
Group: Fivesigmadepth; Subgroup: Yr 1; Slicer: UniSlicer
|
| |
25th%ile fiveSigmaDepth |
75th%ile fiveSigmaDepth |
Count fiveSigmaDepth |
Max fiveSigmaDepth |
Mean fiveSigmaDepth |
Median fiveSigmaDepth |
Min fiveSigmaDepth |
N(+3Sigma) fiveSigmaDepth |
N(-3Sigma) fiveSigmaDepth |
Rms fiveSigmaDepth |
| Yr 1 all bands |
22.60
|
24.01
|
241913
|
25.48
|
23.31
|
23.41
|
20.25
|
0
|
46
|
0.90
|
| Yr 1 g band |
24.18
|
24.74
|
23394
|
25.48
|
24.40
|
24.48
|
21.78
|
0
|
433
|
0.50
|
| Yr 1 i band |
23.40
|
23.91
|
56225
|
24.63
|
23.59
|
23.68
|
20.25
|
0
|
1299
|
0.49
|
| Yr 1 r band |
23.87
|
24.41
|
50660
|
24.98
|
24.06
|
24.17
|
21.30
|
0
|
1273
|
0.52
|
| Yr 1 u band |
23.04
|
23.53
|
16822
|
24.13
|
23.26
|
23.30
|
21.59
|
0
|
119
|
0.37
|
| Yr 1 y band |
21.86
|
22.27
|
49401
|
22.86
|
22.04
|
22.08
|
20.43
|
0
|
362
|
0.31
|
| Yr 1 z band |
22.80
|
23.27
|
45411
|
23.89
|
22.97
|
23.07
|
20.38
|
0
|
1218
|
0.47
|
Group: Ha; Subgroup: All sky
HA Histogram
OneDSlicer
All sky all bands
Histogram of HA for All sky all bands.
HA Histogram
OneDSlicer
All sky u band
Histogram of HA for All sky u band.
HA Histogram
OneDSlicer
All sky g band
Histogram of HA for All sky g band.
HA Histogram
OneDSlicer
All sky r band
Histogram of HA for All sky r band.
HA Histogram
OneDSlicer
All sky i band
Histogram of HA for All sky i band.
HA Histogram
OneDSlicer
All sky z band
Histogram of HA for All sky z band.
HA Histogram
OneDSlicer
All sky y band
Histogram of HA for All sky y band.
Max HA
HealpixSlicer
All sky all bands
Map of Max HA for All sky all bands.
Max HA
HealpixSlicer
All sky u band
Map of Max HA for All sky u band.
Max HA
HealpixSlicer
All sky g band
Map of Max HA for All sky g band.
Max HA
HealpixSlicer
All sky r band
Map of Max HA for All sky r band.
Max HA
HealpixSlicer
All sky i band
Map of Max HA for All sky i band.
Max HA
HealpixSlicer
All sky z band
Map of Max HA for All sky z band.
Max HA
HealpixSlicer
All sky y band
Map of Max HA for All sky y band.
Median HA
HealpixSlicer
All sky all bands
Map of Median HA for All sky all bands.
Median HA
HealpixSlicer
All sky u band
Map of Median HA for All sky u band.
Median HA
HealpixSlicer
All sky g band
Map of Median HA for All sky g band.
Median HA
HealpixSlicer
All sky r band
Map of Median HA for All sky r band.
Median HA
HealpixSlicer
All sky i band
Map of Median HA for All sky i band.
Median HA
HealpixSlicer
All sky z band
Map of Median HA for All sky z band.
Median HA
HealpixSlicer
All sky y band
Map of Median HA for All sky y band.
Min HA
HealpixSlicer
All sky all bands
Map of Min HA for All sky all bands.
Min HA
HealpixSlicer
All sky u band
Map of Min HA for All sky u band.
Min HA
HealpixSlicer
All sky g band
Map of Min HA for All sky g band.
Min HA
HealpixSlicer
All sky r band
Map of Min HA for All sky r band.
Min HA
HealpixSlicer
All sky i band
Map of Min HA for All sky i band.
Min HA
HealpixSlicer
All sky z band
Map of Min HA for All sky z band.
Min HA
HealpixSlicer
All sky y band
Map of Min HA for All sky y band.
|
Group: Ha; Subgroup: All sky; Slicer: HealpixSlicer
|
| Metric Name |
Info Label |
Median |
Mean |
Rms |
N(-3Sigma) |
N(+3Sigma) |
Count |
Min |
Max |
| Max HA |
All sky all bands |
4.89
|
4.92
|
1.31
|
64
|
374
|
33578
|
-1.74
|
11.97
|
| Median HA |
All sky all bands |
0.84
|
0.89
|
0.87
|
351
|
20
|
33578
|
-5.47
|
4.55
|
| Min HA |
All sky all bands |
-4.51
|
-4.49
|
1.35
|
257
|
74
|
33578
|
-11.97
|
1.91
|
| Max HA |
All sky u band |
3.83
|
3.94
|
1.30
|
144
|
260
|
29864
|
-2.86
|
11.87
|
| Median HA |
All sky u band |
0.89
|
0.86
|
1.01
|
178
|
31
|
29864
|
-6.22
|
7.41
|
| Min HA |
All sky u band |
-3.08
|
-3.16
|
1.23
|
270
|
85
|
29864
|
-11.85
|
3.35
|
| Max HA |
All sky g band |
3.72
|
3.84
|
1.25
|
72
|
458
|
33481
|
-3.20
|
11.80
|
| Median HA |
All sky g band |
0.51
|
0.52
|
1.09
|
552
|
22
|
33481
|
-8.39
|
5.68
|
| Min HA |
All sky g band |
-4.03
|
-3.86
|
1.48
|
241
|
53
|
33481
|
-11.97
|
3.22
|
| Max HA |
All sky r band |
4.15
|
4.27
|
1.24
|
80
|
352
|
33540
|
-2.91
|
11.97
|
| Median HA |
All sky r band |
0.69
|
0.74
|
0.94
|
417
|
3
|
33540
|
-7.32
|
5.07
|
| Min HA |
All sky r band |
-4.20
|
-4.12
|
1.38
|
206
|
102
|
33540
|
-11.77
|
3.14
|
| Max HA |
All sky i band |
4.52
|
4.53
|
1.25
|
94
|
205
|
33538
|
-2.47
|
11.60
|
| Median HA |
All sky i band |
0.86
|
0.88
|
0.95
|
524
|
34
|
33538
|
-7.67
|
6.62
|
| Min HA |
All sky i band |
-4.16
|
-4.08
|
1.42
|
192
|
59
|
33538
|
-11.92
|
2.35
|
| Max HA |
All sky z band |
4.59
|
4.58
|
1.24
|
84
|
226
|
33510
|
-2.12
|
11.97
|
| Median HA |
All sky z band |
0.98
|
0.97
|
0.97
|
474
|
50
|
33510
|
-6.46
|
6.74
|
| Min HA |
All sky z band |
-4.19
|
-4.10
|
1.43
|
147
|
70
|
33510
|
-11.93
|
3.10
|
| Max HA |
All sky y band |
4.56
|
4.72
|
1.13
|
136
|
331
|
29952
|
-2.95
|
11.80
|
| Median HA |
All sky y band |
1.28
|
1.24
|
0.84
|
191
|
49
|
29952
|
-4.09
|
6.01
|
| Min HA |
All sky y band |
-3.38
|
-3.43
|
1.21
|
154
|
195
|
29952
|
-11.92
|
4.06
|
|
Group: Ha; Subgroup: All sky; Slicer: UniSlicer
|
| |
25th%ile HA |
75th%ile HA |
Count HA |
Max HA |
Mean HA |
Median HA |
Min HA |
N(+3Sigma) HA |
N(-3Sigma) HA |
Rms HA |
| All sky all bands |
-0.63
|
2.12
|
2147095
|
11.97
|
0.67
|
1.06
|
-11.97
|
959
|
3298
|
2.15
|
| All sky g band |
-1.25
|
1.82
|
196987
|
11.80
|
0.19
|
0.50
|
-11.97
|
162
|
217
|
2.21
|
| All sky i band |
-0.47
|
2.09
|
500895
|
11.60
|
0.72
|
1.08
|
-11.92
|
164
|
1053
|
2.14
|
| All sky r band |
-0.87
|
1.95
|
489465
|
11.97
|
0.43
|
0.83
|
-11.77
|
229
|
337
|
2.16
|
| All sky u band |
-0.71
|
2.08
|
124477
|
11.87
|
0.68
|
0.99
|
-11.85
|
146
|
219
|
2.00
|
| All sky y band |
-0.24
|
2.38
|
394073
|
11.80
|
1.04
|
1.44
|
-11.92
|
276
|
743
|
1.99
|
| All sky z band |
-0.53
|
2.21
|
441198
|
11.97
|
0.77
|
1.16
|
-11.93
|
113
|
578
|
2.24
|
Group: Ha; Subgroup: WFD
HA Histogram
OneDSlicer
WFD all bands
Histogram of HA for WFD all bands.
HA Histogram
OneDSlicer
WFD u band
Histogram of HA for WFD u band.
HA Histogram
OneDSlicer
WFD g band
Histogram of HA for WFD g band.
HA Histogram
OneDSlicer
WFD r band
Histogram of HA for WFD r band.
HA Histogram
OneDSlicer
WFD i band
Histogram of HA for WFD i band.
HA Histogram
OneDSlicer
WFD z band
Histogram of HA for WFD z band.
HA Histogram
OneDSlicer
WFD y band
Histogram of HA for WFD y band.
Max HA
HealpixSubsetSlicer
WFD all bands
Map of Max HA for WFD all bands.
Max HA
HealpixSubsetSlicer
WFD u band
Map of Max HA for WFD u band.
Max HA
HealpixSubsetSlicer
WFD g band
Map of Max HA for WFD g band.
Max HA
HealpixSubsetSlicer
WFD r band
Map of Max HA for WFD r band.
Max HA
HealpixSubsetSlicer
WFD i band
Map of Max HA for WFD i band.
Max HA
HealpixSubsetSlicer
WFD z band
Map of Max HA for WFD z band.
Max HA
HealpixSubsetSlicer
WFD y band
Map of Max HA for WFD y band.
Median HA
HealpixSubsetSlicer
WFD all bands
Map of Median HA for WFD all bands.
Median HA
HealpixSubsetSlicer
WFD u band
Map of Median HA for WFD u band.
Median HA
HealpixSubsetSlicer
WFD g band
Map of Median HA for WFD g band.
Median HA
HealpixSubsetSlicer
WFD r band
Map of Median HA for WFD r band.
Median HA
HealpixSubsetSlicer
WFD i band
Map of Median HA for WFD i band.
Median HA
HealpixSubsetSlicer
WFD z band
Map of Median HA for WFD z band.
Median HA
HealpixSubsetSlicer
WFD y band
Map of Median HA for WFD y band.
Min HA
HealpixSubsetSlicer
WFD all bands
Map of Min HA for WFD all bands.
Min HA
HealpixSubsetSlicer
WFD u band
Map of Min HA for WFD u band.
Min HA
HealpixSubsetSlicer
WFD g band
Map of Min HA for WFD g band.
Min HA
HealpixSubsetSlicer
WFD r band
Map of Min HA for WFD r band.
Min HA
HealpixSubsetSlicer
WFD i band
Map of Min HA for WFD i band.
Min HA
HealpixSubsetSlicer
WFD z band
Map of Min HA for WFD z band.
Min HA
HealpixSubsetSlicer
WFD y band
Map of Min HA for WFD y band.
|
Group: Ha; Subgroup: WFD; Slicer: HealpixSubsetSlicer
|
| Metric Name |
Info Label |
Median |
Mean |
Rms |
N(-3Sigma) |
N(+3Sigma) |
Count |
Min |
Max |
| Max HA |
WFD all bands |
5.11
|
5.16
|
0.89
|
0
|
173
|
22469
|
3.00
|
9.07
|
| Median HA |
WFD all bands |
1.04
|
1.04
|
0.77
|
1
|
0
|
22469
|
-1.47
|
2.47
|
| Min HA |
WFD all bands |
-4.73
|
-4.73
|
0.88
|
35
|
0
|
22469
|
-7.91
|
-2.10
|
| Max HA |
WFD u band |
3.93
|
4.04
|
1.01
|
3
|
176
|
22469
|
0.71
|
7.92
|
| Median HA |
WFD u band |
1.02
|
0.96
|
0.91
|
39
|
0
|
22469
|
-2.12
|
2.93
|
| Min HA |
WFD u band |
-3.23
|
-3.26
|
0.95
|
74
|
5
|
22469
|
-7.23
|
1.26
|
| Max HA |
WFD g band |
3.89
|
4.03
|
0.94
|
0
|
311
|
22469
|
1.52
|
8.49
|
| Median HA |
WFD g band |
0.65
|
0.70
|
0.92
|
59
|
0
|
22469
|
-3.00
|
2.51
|
| Min HA |
WFD g band |
-4.25
|
-4.19
|
0.99
|
0
|
6
|
22469
|
-7.11
|
-1.00
|
| Max HA |
WFD r band |
4.38
|
4.51
|
0.95
|
0
|
206
|
22469
|
2.14
|
9.07
|
| Median HA |
WFD r band |
0.86
|
0.90
|
0.80
|
1
|
0
|
22469
|
-1.91
|
2.45
|
| Min HA |
WFD r band |
-4.46
|
-4.41
|
0.95
|
14
|
0
|
22469
|
-7.91
|
-1.72
|
| Max HA |
WFD i band |
4.84
|
4.83
|
0.90
|
0
|
79
|
22469
|
2.38
|
8.65
|
| Median HA |
WFD i band |
1.03
|
1.03
|
0.78
|
0
|
0
|
22469
|
-0.81
|
2.59
|
| Min HA |
WFD i band |
-4.41
|
-4.34
|
1.03
|
22
|
0
|
22469
|
-7.84
|
-1.38
|
| Max HA |
WFD z band |
4.86
|
4.87
|
0.86
|
0
|
164
|
22469
|
2.43
|
8.50
|
| Median HA |
WFD z band |
1.13
|
1.11
|
0.76
|
2
|
0
|
22469
|
-1.32
|
2.61
|
| Min HA |
WFD z band |
-4.43
|
-4.40
|
1.02
|
10
|
22
|
22469
|
-7.72
|
-1.12
|
| Max HA |
WFD y band |
4.64
|
4.81
|
0.87
|
0
|
224
|
22469
|
2.56
|
8.99
|
| Median HA |
WFD y band |
1.33
|
1.29
|
0.75
|
4
|
0
|
22469
|
-1.70
|
2.74
|
| Min HA |
WFD y band |
-3.56
|
-3.63
|
0.94
|
112
|
0
|
22469
|
-7.46
|
-1.22
|
|
Group: Ha; Subgroup: WFD; Slicer: UniSlicer
|
| |
25th%ile HA |
75th%ile HA |
Count HA |
Max HA |
Mean HA |
Median HA |
Min HA |
N(+3Sigma) HA |
N(-3Sigma) HA |
Rms HA |
| WFD all bands |
-0.63
|
2.12
|
2147095
|
11.97
|
0.67
|
1.06
|
-11.97
|
959
|
3298
|
2.15
|
| WFD g band |
-1.25
|
1.82
|
196987
|
11.80
|
0.19
|
0.50
|
-11.97
|
162
|
217
|
2.21
|
| WFD i band |
-0.47
|
2.09
|
500895
|
11.60
|
0.72
|
1.08
|
-11.92
|
164
|
1053
|
2.14
|
| WFD r band |
-0.87
|
1.95
|
489465
|
11.97
|
0.43
|
0.83
|
-11.77
|
229
|
337
|
2.16
|
| WFD u band |
-0.71
|
2.08
|
124477
|
11.87
|
0.68
|
0.99
|
-11.85
|
146
|
219
|
2.00
|
| WFD y band |
-0.24
|
2.38
|
394073
|
11.80
|
1.04
|
1.44
|
-11.92
|
276
|
743
|
1.99
|
| WFD z band |
-0.53
|
2.21
|
441198
|
11.97
|
0.77
|
1.16
|
-11.93
|
113
|
578
|
2.24
|
Group: InterNight; Subgroup: Night gaps
20thPercentile Inter-Night Gap
HealpixSlicer
All sky all bands
20th percentile gap between nights with observations, All sky all bands.
20thPercentile Inter-Night Gap
HealpixSlicer
All sky u band
20th percentile gap between nights with observations, All sky u band.
20thPercentile Inter-Night Gap
HealpixSlicer
All sky g band
20th percentile gap between nights with observations, All sky g band.
20thPercentile Inter-Night Gap
HealpixSlicer
All sky r band
20th percentile gap between nights with observations, All sky r band.
20thPercentile Inter-Night Gap
HealpixSlicer
All sky i band
20th percentile gap between nights with observations, All sky i band.
20thPercentile Inter-Night Gap
HealpixSlicer
All sky z band
20th percentile gap between nights with observations, All sky z band.
20thPercentile Inter-Night Gap
HealpixSlicer
All sky y band
20th percentile gap between nights with observations, All sky y band.
20thPercentile Inter-Night Gap
HealpixSubsetSlicer
WFD all bands
20th percentile gap between nights with observations, WFD all bands.
20thPercentile Inter-Night Gap
HealpixSubsetSlicer
WFD u band
20th percentile gap between nights with observations, WFD u band.
20thPercentile Inter-Night Gap
HealpixSubsetSlicer
WFD g band
20th percentile gap between nights with observations, WFD g band.
20thPercentile Inter-Night Gap
HealpixSubsetSlicer
WFD r band
20th percentile gap between nights with observations, WFD r band.
20thPercentile Inter-Night Gap
HealpixSubsetSlicer
WFD i band
20th percentile gap between nights with observations, WFD i band.
20thPercentile Inter-Night Gap
HealpixSubsetSlicer
WFD z band
20th percentile gap between nights with observations, WFD z band.
20thPercentile Inter-Night Gap
HealpixSubsetSlicer
WFD y band
20th percentile gap between nights with observations, WFD y band.
DeltaNight Histogram
HealpixSlicer
All sky all bands
Histogram of the number of nights between consecutive visits to a given point on the sky, considering separations between 1 and 20, All sky all bands.
DeltaNight Histogram
HealpixSubsetSlicer
WFD all bands
Histogram of the number of nights between consecutive visits to a given point on the sky, considering separations between 1 and 20, WFD all bands.
Max Inter-Night Gap
HealpixSlicer
All sky all bands
Maximum gap between nights with observations, All sky all bands.
Max Inter-Night Gap
HealpixSlicer
All sky u band
Maximum gap between nights with observations, All sky u band.
Max Inter-Night Gap
HealpixSlicer
All sky g band
Maximum gap between nights with observations, All sky g band.
Max Inter-Night Gap
HealpixSlicer
All sky r band
Maximum gap between nights with observations, All sky r band.
Max Inter-Night Gap
HealpixSlicer
All sky i band
Maximum gap between nights with observations, All sky i band.
Max Inter-Night Gap
HealpixSlicer
All sky z band
Maximum gap between nights with observations, All sky z band.
Max Inter-Night Gap
HealpixSlicer
All sky y band
Maximum gap between nights with observations, All sky y band.
Max Inter-Night Gap
HealpixSubsetSlicer
WFD all bands
Maximum gap between nights with observations, WFD all bands.
Max Inter-Night Gap
HealpixSubsetSlicer
WFD u band
Maximum gap between nights with observations, WFD u band.
Max Inter-Night Gap
HealpixSubsetSlicer
WFD g band
Maximum gap between nights with observations, WFD g band.
Max Inter-Night Gap
HealpixSubsetSlicer
WFD r band
Maximum gap between nights with observations, WFD r band.
Max Inter-Night Gap
HealpixSubsetSlicer
WFD i band
Maximum gap between nights with observations, WFD i band.
Max Inter-Night Gap
HealpixSubsetSlicer
WFD z band
Maximum gap between nights with observations, WFD z band.
Max Inter-Night Gap
HealpixSubsetSlicer
WFD y band
Maximum gap between nights with observations, WFD y band.
Median Inter-Night Gap
HealpixSlicer
All sky all bands
Median gap between nights with observations, All sky all bands.
Median Inter-Night Gap
HealpixSlicer
All sky u band
Median gap between nights with observations, All sky u band.
Median Inter-Night Gap
HealpixSlicer
All sky g band
Median gap between nights with observations, All sky g band.
Median Inter-Night Gap
HealpixSlicer
All sky r band
Median gap between nights with observations, All sky r band.
Median Inter-Night Gap
HealpixSlicer
All sky i band
Median gap between nights with observations, All sky i band.
Median Inter-Night Gap
HealpixSlicer
All sky z band
Median gap between nights with observations, All sky z band.
Median Inter-Night Gap
HealpixSlicer
All sky y band
Median gap between nights with observations, All sky y band.
Median Inter-Night Gap
HealpixSubsetSlicer
WFD all bands
Median gap between nights with observations, WFD all bands.
Median Inter-Night Gap
HealpixSubsetSlicer
WFD u band
Median gap between nights with observations, WFD u band.
Median Inter-Night Gap
HealpixSubsetSlicer
WFD g band
Median gap between nights with observations, WFD g band.
Median Inter-Night Gap
HealpixSubsetSlicer
WFD r band
Median gap between nights with observations, WFD r band.
Median Inter-Night Gap
HealpixSubsetSlicer
WFD i band
Median gap between nights with observations, WFD i band.
Median Inter-Night Gap
HealpixSubsetSlicer
WFD z band
Median gap between nights with observations, WFD z band.
Median Inter-Night Gap
HealpixSubsetSlicer
WFD y band
Median gap between nights with observations, WFD y band.
N Unique Nights
HealpixSlicer
All sky all bands
Number of unique nights with visits
N Unique Nights
HealpixSubsetSlicer
WFD all bands
Number of unique nights with visits
|
Group: InterNight; Subgroup: Night gaps; Slicer: HealpixSlicer
|
| Metric Name |
Info Label |
Median |
Mean |
Rms |
N(-3Sigma) |
N(+3Sigma) |
Count |
Min |
Max |
| 20thPercentile Inter-Night Gap |
All sky all bands |
1.00
|
4.36
|
52.66
|
0
|
119
|
33528
|
0.93
|
3358.76
|
| Max Inter-Night Gap |
All sky all bands |
247.27
|
258.80
|
109.27
|
0
|
498
|
33528
|
4.96
|
3358.76
|
| Median Inter-Night Gap |
All sky all bands |
2.96
|
9.92
|
62.45
|
0
|
224
|
33528
|
1.01
|
3358.76
|
| N Unique Nights |
All sky all bands |
364.00
|
296.22
|
126.23
|
0
|
7
|
33578
|
1.00
|
724.00
|
| 20thPercentile Inter-Night Gap |
All sky u band |
4.00
|
15.97
|
96.32
|
0
|
274
|
29753
|
0.87
|
3396.85
|
| Max Inter-Night Gap |
All sky u band |
612.22
|
680.71
|
434.29
|
0
|
850
|
29753
|
0.93
|
3576.93
|
| Median Inter-Night Gap |
All sky u band |
26.90
|
66.43
|
140.68
|
0
|
456
|
29753
|
0.93
|
3396.85
|
| 20thPercentile Inter-Night Gap |
All sky g band |
4.76
|
12.86
|
90.05
|
0
|
194
|
33399
|
1.00
|
3575.18
|
| Max Inter-Night Gap |
All sky g band |
381.90
|
466.10
|
210.86
|
0
|
508
|
33399
|
8.00
|
3575.18
|
| Median Inter-Night Gap |
All sky g band |
20.36
|
40.19
|
105.58
|
0
|
274
|
33399
|
1.98
|
3575.18
|
| 20thPercentile Inter-Night Gap |
All sky r band |
2.00
|
7.67
|
61.19
|
0
|
175
|
33466
|
0.99
|
2900.13
|
| Max Inter-Night Gap |
All sky r band |
309.20
|
342.46
|
152.84
|
0
|
516
|
33466
|
7.04
|
3311.00
|
| Median Inter-Night Gap |
All sky r band |
6.50
|
20.95
|
79.85
|
0
|
473
|
33466
|
1.89
|
2900.13
|
| 20thPercentile Inter-Night Gap |
All sky i band |
2.12
|
8.46
|
64.88
|
0
|
180
|
33472
|
0.98
|
3259.00
|
| Max Inter-Night Gap |
All sky i band |
306.12
|
333.94
|
145.83
|
0
|
423
|
33472
|
5.01
|
3259.00
|
| Median Inter-Night Gap |
All sky i band |
7.47
|
20.18
|
78.98
|
0
|
306
|
33472
|
1.92
|
3259.00
|
| 20thPercentile Inter-Night Gap |
All sky z band |
2.35
|
10.99
|
83.88
|
0
|
186
|
33450
|
0.99
|
3358.81
|
| Max Inter-Night Gap |
All sky z band |
310.18
|
361.56
|
183.16
|
0
|
689
|
33450
|
29.99
|
3358.81
|
| Median Inter-Night Gap |
All sky z band |
8.78
|
26.37
|
97.05
|
0
|
306
|
33450
|
1.86
|
3358.81
|
| 20thPercentile Inter-Night Gap |
All sky y band |
2.00
|
12.47
|
86.06
|
0
|
235
|
29889
|
0.98
|
3223.18
|
| Max Inter-Night Gap |
All sky y band |
324.06
|
383.00
|
194.36
|
0
|
680
|
29889
|
59.72
|
3404.68
|
| Median Inter-Night Gap |
All sky y band |
15.38
|
37.11
|
109.92
|
0
|
437
|
29889
|
1.90
|
3223.18
|
|
Group: InterNight; Subgroup: Night gaps; Slicer: HealpixSubsetSlicer
|
| Metric Name |
Info Label |
Median |
Mean |
Rms |
N(-3Sigma) |
N(+3Sigma) |
Count |
Min |
Max |
| 20thPercentile Inter-Night Gap |
WFD all bands |
0.99
|
1.01
|
0.10
|
0
|
360
|
22469
|
0.93
|
1.94
|
| Max Inter-Night Gap |
WFD all bands |
235.21
|
233.08
|
36.89
|
19
|
27
|
22469
|
98.27
|
569.32
|
| Median Inter-Night Gap |
WFD all bands |
2.89
|
2.67
|
0.53
|
7
|
5
|
22469
|
1.01
|
4.91
|
| N Unique Nights |
WFD all bands |
374.00
|
376.33
|
21.63
|
0
|
103
|
22469
|
320.00
|
724.00
|
| 20thPercentile Inter-Night Gap |
WFD u band |
3.91
|
4.35
|
3.17
|
0
|
513
|
22469
|
0.99
|
45.89
|
| Max Inter-Night Gap |
WFD u band |
586.18
|
521.98
|
150.60
|
0
|
367
|
22469
|
205.04
|
1447.17
|
| Median Inter-Night Gap |
WFD u band |
25.89
|
27.44
|
11.62
|
0
|
471
|
22469
|
2.14
|
259.24
|
| 20thPercentile Inter-Night Gap |
WFD g band |
4.00
|
4.25
|
1.42
|
0
|
286
|
22469
|
1.00
|
15.99
|
| Max Inter-Night Gap |
WFD g band |
360.03
|
408.23
|
117.51
|
0
|
0
|
22469
|
137.25
|
758.87
|
| Median Inter-Night Gap |
WFD g band |
18.07
|
18.40
|
4.11
|
75
|
45
|
22469
|
1.98
|
37.04
|
| 20thPercentile Inter-Night Gap |
WFD r band |
1.98
|
1.93
|
0.39
|
0
|
72
|
22469
|
0.99
|
4.71
|
| Max Inter-Night Gap |
WFD r band |
295.36
|
306.67
|
73.38
|
0
|
1148
|
22469
|
138.24
|
619.30
|
| Median Inter-Night Gap |
WFD r band |
5.94
|
5.82
|
1.26
|
9
|
134
|
22469
|
1.89
|
14.89
|
| 20thPercentile Inter-Night Gap |
WFD i band |
2.02
|
2.21
|
0.46
|
0
|
192
|
22469
|
0.98
|
5.55
|
| Max Inter-Night Gap |
WFD i band |
293.00
|
301.92
|
69.64
|
0
|
992
|
22469
|
138.24
|
613.25
|
| Median Inter-Night Gap |
WFD i band |
6.95
|
6.87
|
1.16
|
56
|
144
|
22469
|
1.92
|
15.64
|
| 20thPercentile Inter-Night Gap |
WFD z band |
2.03
|
2.28
|
0.56
|
0
|
457
|
22469
|
0.99
|
6.94
|
| Max Inter-Night Gap |
WFD z band |
293.18
|
303.34
|
69.29
|
0
|
991
|
22469
|
137.25
|
618.32
|
| Median Inter-Night Gap |
WFD z band |
7.92
|
8.02
|
2.00
|
6
|
473
|
22469
|
1.86
|
21.85
|
| 20thPercentile Inter-Night Gap |
WFD y band |
1.98
|
1.99
|
0.76
|
0
|
440
|
22469
|
0.99
|
15.38
|
| Max Inter-Night Gap |
WFD y band |
309.13
|
322.20
|
65.85
|
0
|
1053
|
22469
|
176.29
|
640.23
|
| Median Inter-Night Gap |
WFD y band |
11.97
|
12.94
|
6.18
|
0
|
0
|
22469
|
1.90
|
31.49
|
Group: IntraNight; Subgroup: Pairs
75th Percentile Intranight Timespan
HealpixSlicer
All sky all bands
75th percentile value of the maximum intra-night timespan, on each night, All sky all bands.
75th Percentile Intranight Timespan
HealpixSlicer
All sky u band
75th percentile value of the maximum intra-night timespan, on each night, All sky all bands., All sky u band.
75th Percentile Intranight Timespan
HealpixSlicer
All sky g band
75th percentile value of the maximum intra-night timespan, on each night, All sky all bands., All sky u band., All sky g band.
75th Percentile Intranight Timespan
HealpixSlicer
All sky r band
75th percentile value of the maximum intra-night timespan, on each night, All sky all bands., All sky u band., All sky g band., All sky r band.
75th Percentile Intranight Timespan
HealpixSlicer
All sky i band
75th percentile value of the maximum intra-night timespan, on each night, All sky all bands., All sky u band., All sky g band., All sky r band., All sky i band.
75th Percentile Intranight Timespan
HealpixSlicer
All sky z band
75th percentile value of the maximum intra-night timespan, on each night, All sky all bands., All sky u band., All sky g band., All sky r band., All sky i band., All sky z band.
75th Percentile Intranight Timespan
HealpixSlicer
All sky y band
75th percentile value of the maximum intra-night timespan, on each night, All sky all bands., All sky u band., All sky g band., All sky r band., All sky i band., All sky z band., All sky y band.
75th Percentile Intranight Timespan
HealpixSlicer
All sky
75th percentile value of the maximum intra-night timespan, on each night, All sky all bands., All sky u band., All sky g band., All sky r band., All sky i band., All sky z band., All sky y band., All sky.
75th Percentile Intranight Timespan
HealpixSlicer
All sky ug bands
75th percentile value of the maximum intra-night timespan, on each night, All sky all bands., All sky u band., All sky g band., All sky r band., All sky i band., All sky z band., All sky y band., All sky., All sky.
75th Percentile Intranight Timespan
HealpixSlicer
All sky gr bands
75th percentile value of the maximum intra-night timespan, on each night, All sky all bands., All sky u band., All sky g band., All sky r band., All sky i band., All sky z band., All sky y band., All sky., All sky., All sky.
75th Percentile Intranight Timespan
HealpixSlicer
All sky ri bands
75th percentile value of the maximum intra-night timespan, on each night, All sky all bands., All sky u band., All sky g band., All sky r band., All sky i band., All sky z band., All sky y band., All sky., All sky., All sky., All sky.
75th Percentile Intranight Timespan
HealpixSlicer
All sky iz bands
75th percentile value of the maximum intra-night timespan, on each night, All sky all bands., All sky u band., All sky g band., All sky r band., All sky i band., All sky z band., All sky y band., All sky., All sky., All sky., All sky., All sky.
75th Percentile Intranight Timespan
HealpixSlicer
All sky zy bands
75th percentile value of the maximum intra-night timespan, on each night, All sky all bands., All sky u band., All sky g band., All sky r band., All sky i band., All sky z band., All sky y band., All sky., All sky., All sky., All sky., All sky., All sky.
75th Percentile Intranight Timespan
HealpixSubsetSlicer
WFD all bands
75th percentile value of the maximum intra-night timespan, on each night, WFD all bands.
75th Percentile Intranight Timespan
HealpixSubsetSlicer
WFD u band
75th percentile value of the maximum intra-night timespan, on each night, WFD all bands., WFD u band.
75th Percentile Intranight Timespan
HealpixSubsetSlicer
WFD g band
75th percentile value of the maximum intra-night timespan, on each night, WFD all bands., WFD u band., WFD g band.
75th Percentile Intranight Timespan
HealpixSubsetSlicer
WFD r band
75th percentile value of the maximum intra-night timespan, on each night, WFD all bands., WFD u band., WFD g band., WFD r band.
75th Percentile Intranight Timespan
HealpixSubsetSlicer
WFD i band
75th percentile value of the maximum intra-night timespan, on each night, WFD all bands., WFD u band., WFD g band., WFD r band., WFD i band.
75th Percentile Intranight Timespan
HealpixSubsetSlicer
WFD z band
75th percentile value of the maximum intra-night timespan, on each night, WFD all bands., WFD u band., WFD g band., WFD r band., WFD i band., WFD z band.
75th Percentile Intranight Timespan
HealpixSubsetSlicer
WFD y band
75th percentile value of the maximum intra-night timespan, on each night, WFD all bands., WFD u band., WFD g band., WFD r band., WFD i band., WFD z band., WFD y band.
75th Percentile Intranight Timespan
HealpixSubsetSlicer
WFD
75th percentile value of the maximum intra-night timespan, on each night, WFD all bands., WFD u band., WFD g band., WFD r band., WFD i band., WFD z band., WFD y band., WFD.
75th Percentile Intranight Timespan
HealpixSubsetSlicer
WFD ug bands
75th percentile value of the maximum intra-night timespan, on each night, WFD all bands., WFD u band., WFD g band., WFD r band., WFD i band., WFD z band., WFD y band., WFD., WFD.
75th Percentile Intranight Timespan
HealpixSubsetSlicer
WFD gr bands
75th percentile value of the maximum intra-night timespan, on each night, WFD all bands., WFD u band., WFD g band., WFD r band., WFD i band., WFD z band., WFD y band., WFD., WFD., WFD.
75th Percentile Intranight Timespan
HealpixSubsetSlicer
WFD ri bands
75th percentile value of the maximum intra-night timespan, on each night, WFD all bands., WFD u band., WFD g band., WFD r band., WFD i band., WFD z band., WFD y band., WFD., WFD., WFD., WFD.
75th Percentile Intranight Timespan
HealpixSubsetSlicer
WFD iz bands
75th percentile value of the maximum intra-night timespan, on each night, WFD all bands., WFD u band., WFD g band., WFD r band., WFD i band., WFD z band., WFD y band., WFD., WFD., WFD., WFD., WFD.
75th Percentile Intranight Timespan
HealpixSubsetSlicer
WFD zy bands
75th percentile value of the maximum intra-night timespan, on each night, WFD all bands., WFD u band., WFD g band., WFD r band., WFD i band., WFD z band., WFD y band., WFD., WFD., WFD., WFD., WFD., WFD.
DeltaT Histogram
HealpixSlicer
All sky
Histogram of the time between consecutive visits to a given point on the sky, considering visits between 0.0 and 120.0 minutes, All sky.
DeltaT Histogram
HealpixSubsetSlicer
WFD
Histogram of the time between consecutive visits to a given point on the sky, considering visits between 0.0 and 120.0 minutes, WFD.
Fraction of visits in pairs (10-60 min)
HealpixSlicer
gri All sky
Fraction of gri All sky visits that have a paired visitbetween 10.0 and 60.0 minutes away. If all visits were in pairs, this fraction would be 1.
Fraction of visits in pairs (10-60 min)
HealpixSubsetSlicer
gri WFD
Fraction of gri WFD visits that have a paired visitbetween 10.0 and 60.0 minutes away. If all visits were in pairs, this fraction would be 1.
Fraction of visits in pairs (20-90 min)
HealpixSlicer
gri All sky
Fraction of gri All sky visits that have a paired visitbetween 20.0 and 90.0 minutes away. If all visits were in pairs, this fraction would be 1.
Fraction of visits in pairs (20-90 min)
HealpixSubsetSlicer
gri WFD
Fraction of gri WFD visits that have a paired visitbetween 20.0 and 90.0 minutes away. If all visits were in pairs, this fraction would be 1.
Fraction of visits with a revisit < 60 min
HealpixSlicer
gri All sky
Fraction of gri All sky visits that have another visit within 60.0 min. If all visits were in pairs (only), this fraction would be 0.5.
Fraction of visits with a revisit < 60 min
HealpixSubsetSlicer
gri WFD
Fraction of gri WFD visits that have another visit within 60.0 min. If all visits were in pairs (only), this fraction would be 0.5.
Median Intra-Night Gap
HealpixSlicer
All sky
Median gap between consecutive visits within a night, all bands, All sky.
Median Intra-Night Gap
HealpixSubsetSlicer
WFD
Median gap between consecutive visits within a night, all bands, WFD.
NVisitsPerNight
HealpixSlicer
All sky
Histogram of the number of visits in each night, per point on the sky, All sky.
NVisitsPerNight
HealpixSubsetSlicer
WFD
Histogram of the number of visits in each night, per point on the sky, WFD.
|
Group: IntraNight; Subgroup: Pairs; Slicer: HealpixSlicer
|
| Metric Name |
Info Label |
Median |
Mean |
Rms |
N(-3Sigma) |
N(+3Sigma) |
Count |
Min |
Max |
| 75th Percentile Intranight Timespan |
All sky all bands |
34.84
|
36.07
|
12.76
|
0
|
334
|
33565
|
15.47
|
255.23
|
| 75th Percentile Intranight Timespan |
All sky u band |
2.73
|
19.42
|
49.97
|
0
|
955
|
27829
|
0.59
|
430.89
|
| Fraction of visits in pairs (10-60 min) |
gri All sky |
0.57
|
0.57
|
0.07
|
236
|
218
|
33571
|
0.0000
|
1.00
|
| 75th Percentile Intranight Timespan |
All sky g band |
2.57
|
9.04
|
26.81
|
0
|
658
|
32339
|
0.64
|
452.76
|
| Fraction of visits in pairs (20-90 min) |
gri All sky |
0.51
|
0.51
|
0.07
|
139
|
164
|
33571
|
0.0000
|
1.00
|
| 75th Percentile Intranight Timespan |
All sky r band |
14.40
|
53.36
|
76.62
|
0
|
470
|
32826
|
0.64
|
346.71
|
| Fraction of visits with a revisit < 60 min |
gri All sky |
0.39
|
0.39
|
0.05
|
139
|
128
|
33571
|
0.0000
|
0.97
|
| Median Intra-Night Gap |
All sky |
0.55
|
0.54
|
0.06
|
1045
|
0
|
33565
|
0.0100
|
0.68
|
| 75th Percentile Intranight Timespan |
All sky i band |
13.32
|
32.72
|
56.44
|
0
|
1359
|
32872
|
0.64
|
351.82
|
| 75th Percentile Intranight Timespan |
All sky z band |
13.31
|
29.22
|
50.23
|
0
|
1099
|
32815
|
0.64
|
374.91
|
| 75th Percentile Intranight Timespan |
All sky y band |
32.95
|
33.07
|
4.28
|
30
|
69
|
29863
|
12.22
|
286.63
|
| 75th Percentile Intranight Timespan |
All sky |
34.84
|
36.07
|
12.76
|
0
|
334
|
33565
|
15.47
|
255.23
|
| 75th Percentile Intranight Timespan |
All sky ug bands |
33.04
|
30.00
|
14.10
|
0
|
229
|
32943
|
0.59
|
401.57
|
| 75th Percentile Intranight Timespan |
All sky gr bands |
34.94
|
42.90
|
36.35
|
0
|
1025
|
33472
|
13.29
|
340.20
|
| 75th Percentile Intranight Timespan |
All sky ri bands |
34.96
|
41.93
|
31.88
|
0
|
917
|
33430
|
9.01
|
301.42
|
| 75th Percentile Intranight Timespan |
All sky iz bands |
34.78
|
37.72
|
21.00
|
0
|
612
|
33488
|
8.85
|
317.88
|
| 75th Percentile Intranight Timespan |
All sky zy bands |
34.43
|
31.93
|
9.20
|
1649
|
79
|
33093
|
0.64
|
238.17
|
|
Group: IntraNight; Subgroup: Pairs; Slicer: HealpixSubsetSlicer
|
| Metric Name |
Info Label |
Median |
Mean |
Rms |
N(-3Sigma) |
N(+3Sigma) |
Count |
Min |
Max |
| 75th Percentile Intranight Timespan |
WFD all bands |
34.90
|
34.97
|
1.57
|
0
|
93
|
22469
|
34.19
|
69.71
|
| 75th Percentile Intranight Timespan |
WFD u band |
2.99
|
16.67
|
41.67
|
0
|
726
|
22450
|
0.59
|
365.08
|
| Fraction of visits in pairs (10-60 min) |
gri WFD |
0.56
|
0.56
|
0.05
|
2
|
174
|
22469
|
0.41
|
0.99
|
| 75th Percentile Intranight Timespan |
WFD g band |
2.59
|
6.59
|
16.09
|
0
|
295
|
22468
|
0.64
|
363.59
|
| Fraction of visits in pairs (20-90 min) |
gri WFD |
0.50
|
0.50
|
0.05
|
26
|
205
|
22469
|
0.29
|
0.79
|
| 75th Percentile Intranight Timespan |
WFD r band |
16.53
|
46.59
|
64.15
|
0
|
630
|
22469
|
0.65
|
333.66
|
| Fraction of visits with a revisit < 60 min |
gri WFD |
0.39
|
0.39
|
0.05
|
0
|
127
|
22469
|
0.29
|
0.97
|
| Median Intra-Night Gap |
WFD |
0.55
|
0.54
|
0.05
|
333
|
0
|
22469
|
0.0100
|
0.57
|
| 75th Percentile Intranight Timespan |
WFD i band |
13.36
|
26.99
|
41.98
|
0
|
724
|
22469
|
0.65
|
297.75
|
| 75th Percentile Intranight Timespan |
WFD z band |
13.33
|
23.12
|
36.03
|
0
|
671
|
22469
|
0.65
|
300.98
|
| 75th Percentile Intranight Timespan |
WFD y band |
32.98
|
33.00
|
1.13
|
12
|
57
|
22469
|
12.22
|
131.71
|
| 75th Percentile Intranight Timespan |
WFD |
34.90
|
34.97
|
1.57
|
0
|
93
|
22469
|
34.19
|
69.71
|
| 75th Percentile Intranight Timespan |
WFD ug bands |
33.11
|
32.34
|
5.54
|
510
|
46
|
22469
|
1.29
|
242.75
|
| 75th Percentile Intranight Timespan |
WFD gr bands |
35.00
|
36.05
|
7.75
|
0
|
290
|
22469
|
33.39
|
272.40
|
| 75th Percentile Intranight Timespan |
WFD ri bands |
35.04
|
36.47
|
8.38
|
0
|
427
|
22469
|
29.32
|
268.83
|
| 75th Percentile Intranight Timespan |
WFD iz bands |
34.86
|
35.02
|
2.65
|
0
|
173
|
22469
|
34.15
|
187.96
|
| 75th Percentile Intranight Timespan |
WFD zy bands |
34.49
|
34.52
|
0.27
|
115
|
119
|
22469
|
32.23
|
41.39
|
Group: IntraSeason; Subgroup: Season length
80thPercentile Season Length
HealpixSlicer
All sky all bands
80th percentile season length, All sky all bands.
80thPercentile Season Length
HealpixSlicer
All sky u band
80th percentile season length, All sky u band.
80thPercentile Season Length
HealpixSlicer
All sky g band
80th percentile season length, All sky g band.
80thPercentile Season Length
HealpixSlicer
All sky r band
80th percentile season length, All sky r band.
80thPercentile Season Length
HealpixSlicer
All sky i band
80th percentile season length, All sky i band.
80thPercentile Season Length
HealpixSlicer
All sky z band
80th percentile season length, All sky z band.
80thPercentile Season Length
HealpixSlicer
All sky y band
80th percentile season length, All sky y band.
80thPercentile Season Length
HealpixSubsetSlicer
WFD all bands
80th percentile season length, WFD all bands.
80thPercentile Season Length
HealpixSubsetSlicer
WFD u band
80th percentile season length, WFD u band.
80thPercentile Season Length
HealpixSubsetSlicer
WFD g band
80th percentile season length, WFD g band.
80thPercentile Season Length
HealpixSubsetSlicer
WFD r band
80th percentile season length, WFD r band.
80thPercentile Season Length
HealpixSubsetSlicer
WFD i band
80th percentile season length, WFD i band.
80thPercentile Season Length
HealpixSubsetSlicer
WFD z band
80th percentile season length, WFD z band.
80thPercentile Season Length
HealpixSubsetSlicer
WFD y band
80th percentile season length, WFD y band.
Median Season Length
HealpixSlicer
All sky all bands
Median season length, All sky all bands.
Median Season Length
HealpixSlicer
All sky u band
Median season length, All sky u band.
Median Season Length
HealpixSlicer
All sky g band
Median season length, All sky g band.
Median Season Length
HealpixSlicer
All sky r band
Median season length, All sky r band.
Median Season Length
HealpixSlicer
All sky i band
Median season length, All sky i band.
Median Season Length
HealpixSlicer
All sky z band
Median season length, All sky z band.
Median Season Length
HealpixSlicer
All sky y band
Median season length, All sky y band.
Median Season Length
HealpixSubsetSlicer
WFD all bands
Median season length, WFD all bands.
Median Season Length
HealpixSubsetSlicer
WFD u band
Median season length, WFD u band.
Median Season Length
HealpixSubsetSlicer
WFD g band
Median season length, WFD g band.
Median Season Length
HealpixSubsetSlicer
WFD r band
Median season length, WFD r band.
Median Season Length
HealpixSubsetSlicer
WFD i band
Median season length, WFD i band.
Median Season Length
HealpixSubsetSlicer
WFD z band
Median season length, WFD z band.
Median Season Length
HealpixSubsetSlicer
WFD y band
Median season length, WFD y band.
NSeasons
HealpixSlicer
All sky all bands
Number of seasons, any filter.
NSeasons
HealpixSubsetSlicer
WFD all bands
Number of seasons, any filter.
|
Group: IntraSeason; Subgroup: Season length; Slicer: HealpixSlicer
|
| Metric Name |
Info Label |
Median |
Mean |
Rms |
N(-3Sigma) |
N(+3Sigma) |
Count |
Min |
Max |
| 80thPercentile Season Length |
All sky all bands |
185.93
|
184.36
|
33.61
|
326
|
172
|
33578
|
0.0000
|
347.01
|
| Median Season Length |
All sky all bands |
166.64
|
160.64
|
33.96
|
454
|
79
|
33578
|
0.0000
|
296.71
|
| NSeasons |
All sky all bands |
11.00
|
10.46
|
0.84
|
315
|
0
|
33578
|
1.00
|
11.00
|
| 80thPercentile Season Length |
All sky u band |
119.52
|
108.01
|
43.52
|
0
|
32
|
29864
|
0.0000
|
350.74
|
| Median Season Length |
All sky u band |
74.76
|
68.44
|
37.99
|
0
|
9
|
29864
|
0.0000
|
240.93
|
| 80thPercentile Season Length |
All sky g band |
128.70
|
124.35
|
34.69
|
442
|
70
|
33481
|
0.0000
|
328.84
|
| Median Season Length |
All sky g band |
94.98
|
88.40
|
37.39
|
0
|
53
|
33481
|
0.0000
|
259.22
|
| 80thPercentile Season Length |
All sky r band |
159.08
|
154.44
|
34.64
|
657
|
77
|
33540
|
0.0000
|
284.75
|
| Median Season Length |
All sky r band |
139.19
|
128.11
|
37.18
|
853
|
17
|
33540
|
0.0000
|
260.21
|
| 80thPercentile Season Length |
All sky i band |
162.70
|
158.18
|
31.69
|
458
|
117
|
33538
|
0.0000
|
322.78
|
| Median Season Length |
All sky i band |
141.69
|
131.55
|
35.11
|
708
|
23
|
33538
|
0.0000
|
272.63
|
| 80thPercentile Season Length |
All sky z band |
162.82
|
156.05
|
37.52
|
415
|
40
|
33509
|
0.0000
|
301.76
|
| Median Season Length |
All sky z band |
139.74
|
125.81
|
41.48
|
533
|
13
|
33509
|
0.0000
|
257.19
|
| 80thPercentile Season Length |
All sky y band |
154.67
|
149.82
|
40.45
|
698
|
1
|
29952
|
0.0000
|
271.73
|
| Median Season Length |
All sky y band |
126.78
|
117.97
|
42.16
|
0
|
4
|
29952
|
0.0000
|
261.29
|
|
Group: IntraSeason; Subgroup: Season length; Slicer: HealpixSubsetSlicer
|
| Metric Name |
Info Label |
Median |
Mean |
Rms |
N(-3Sigma) |
N(+3Sigma) |
Count |
Min |
Max |
| 80thPercentile Season Length |
WFD all bands |
193.04
|
196.50
|
22.07
|
0
|
232
|
22469
|
144.86
|
347.01
|
| Median Season Length |
WFD all bands |
172.72
|
174.57
|
19.79
|
27
|
247
|
22469
|
95.81
|
296.71
|
| NSeasons |
WFD all bands |
11.00
|
10.58
|
0.49
|
9
|
0
|
22469
|
9.00
|
11.00
|
| 80thPercentile Season Length |
WFD u band |
123.99
|
125.22
|
22.61
|
63
|
62
|
22469
|
27.03
|
243.67
|
| Median Season Length |
WFD u band |
86.38
|
82.58
|
27.29
|
9
|
23
|
22469
|
0.0000
|
195.78
|
| 80thPercentile Season Length |
WFD g band |
137.36
|
138.24
|
19.50
|
0
|
185
|
22469
|
82.81
|
260.70
|
| Median Season Length |
WFD g band |
104.99
|
104.71
|
23.53
|
143
|
77
|
22469
|
6.10
|
259.22
|
| 80thPercentile Season Length |
WFD r band |
167.55
|
168.98
|
18.54
|
0
|
368
|
22469
|
122.76
|
284.75
|
| Median Season Length |
WFD r band |
145.30
|
145.43
|
17.13
|
35
|
233
|
22469
|
62.92
|
260.21
|
| 80thPercentile Season Length |
WFD i band |
166.67
|
170.12
|
17.79
|
0
|
297
|
22469
|
130.66
|
286.65
|
| Median Season Length |
WFD i band |
147.17
|
146.62
|
17.71
|
212
|
163
|
22469
|
59.85
|
272.63
|
| 80thPercentile Season Length |
WFD z band |
169.74
|
172.47
|
19.81
|
0
|
273
|
22469
|
120.79
|
298.71
|
| Median Season Length |
WFD z band |
146.69
|
146.80
|
18.39
|
179
|
230
|
22469
|
54.87
|
257.19
|
| 80thPercentile Season Length |
WFD y band |
160.77
|
164.58
|
21.59
|
0
|
384
|
22469
|
111.71
|
271.73
|
| Median Season Length |
WFD y band |
139.29
|
135.03
|
20.16
|
62
|
149
|
22469
|
55.84
|
261.29
|
Group: Moondistance; Subgroup: All sky
Max moonDistance
HealpixSlicer
All sky all bands
Map of Max moonDistance for All sky all bands.
Max moonDistance
HealpixSlicer
All sky u band
Map of Max moonDistance for All sky u band.
Max moonDistance
HealpixSlicer
All sky g band
Map of Max moonDistance for All sky g band.
Max moonDistance
HealpixSlicer
All sky r band
Map of Max moonDistance for All sky r band.
Max moonDistance
HealpixSlicer
All sky i band
Map of Max moonDistance for All sky i band.
Max moonDistance
HealpixSlicer
All sky z band
Map of Max moonDistance for All sky z band.
Max moonDistance
HealpixSlicer
All sky y band
Map of Max moonDistance for All sky y band.
Median moonDistance
HealpixSlicer
All sky all bands
Map of Median moonDistance for All sky all bands.
Median moonDistance
HealpixSlicer
All sky u band
Map of Median moonDistance for All sky u band.
Median moonDistance
HealpixSlicer
All sky g band
Map of Median moonDistance for All sky g band.
Median moonDistance
HealpixSlicer
All sky r band
Map of Median moonDistance for All sky r band.
Median moonDistance
HealpixSlicer
All sky i band
Map of Median moonDistance for All sky i band.
Median moonDistance
HealpixSlicer
All sky z band
Map of Median moonDistance for All sky z band.
Median moonDistance
HealpixSlicer
All sky y band
Map of Median moonDistance for All sky y band.
Min moonDistance
HealpixSlicer
All sky all bands
Map of Min moonDistance for All sky all bands.
Min moonDistance
HealpixSlicer
All sky u band
Map of Min moonDistance for All sky u band.
Min moonDistance
HealpixSlicer
All sky g band
Map of Min moonDistance for All sky g band.
Min moonDistance
HealpixSlicer
All sky r band
Map of Min moonDistance for All sky r band.
Min moonDistance
HealpixSlicer
All sky i band
Map of Min moonDistance for All sky i band.
Min moonDistance
HealpixSlicer
All sky z band
Map of Min moonDistance for All sky z band.
Min moonDistance
HealpixSlicer
All sky y band
Map of Min moonDistance for All sky y band.
moonDistance Histogram
OneDSlicer
All sky all bands
Histogram of moonDistance for All sky all bands.
moonDistance Histogram
OneDSlicer
All sky u band
Histogram of moonDistance for All sky u band.
moonDistance Histogram
OneDSlicer
All sky g band
Histogram of moonDistance for All sky g band.
moonDistance Histogram
OneDSlicer
All sky r band
Histogram of moonDistance for All sky r band.
moonDistance Histogram
OneDSlicer
All sky i band
Histogram of moonDistance for All sky i band.
moonDistance Histogram
OneDSlicer
All sky z band
Histogram of moonDistance for All sky z band.
moonDistance Histogram
OneDSlicer
All sky y band
Histogram of moonDistance for All sky y band.
|
Group: Moondistance; Subgroup: All sky; Slicer: HealpixSlicer
|
| Metric Name |
Info Label |
Median |
Mean |
Rms |
N(-3Sigma) |
N(+3Sigma) |
Count |
Min |
Max |
| Max moonDistance |
All sky all bands |
161.38
|
156.17
|
20.08
|
34
|
0
|
33578
|
32.73
|
179.90
|
| Median moonDistance |
All sky all bands |
89.02
|
90.94
|
9.88
|
32
|
489
|
33578
|
32.73
|
170.10
|
| Min moonDistance |
All sky all bands |
30.19
|
36.59
|
12.47
|
0
|
607
|
33578
|
10.28
|
170.04
|
| Max moonDistance |
All sky u band |
155.19
|
151.92
|
19.90
|
18
|
0
|
29864
|
31.52
|
179.73
|
| Median moonDistance |
All sky u band |
125.63
|
123.89
|
13.33
|
134
|
13
|
29864
|
31.52
|
176.39
|
| Min moonDistance |
All sky u band |
52.57
|
55.06
|
17.36
|
0
|
385
|
29864
|
12.31
|
176.39
|
| Max moonDistance |
All sky g band |
159.53
|
154.40
|
19.77
|
34
|
0
|
33481
|
35.83
|
179.81
|
| Median moonDistance |
All sky g band |
116.03
|
115.12
|
10.72
|
104
|
39
|
33481
|
35.83
|
163.40
|
| Min moonDistance |
All sky g band |
46.28
|
48.18
|
13.16
|
0
|
221
|
33481
|
12.51
|
159.65
|
| Max moonDistance |
All sky r band |
160.90
|
155.54
|
19.96
|
28
|
0
|
33540
|
49.54
|
179.90
|
| Median moonDistance |
All sky r band |
113.21
|
112.12
|
10.23
|
236
|
51
|
33540
|
49.54
|
170.04
|
| Min moonDistance |
All sky r band |
35.58
|
40.96
|
13.10
|
0
|
289
|
33540
|
12.35
|
170.04
|
| Max moonDistance |
All sky i band |
160.32
|
155.05
|
20.13
|
46
|
0
|
33538
|
33.44
|
179.90
|
| Median moonDistance |
All sky i band |
91.42
|
92.38
|
10.12
|
86
|
244
|
33538
|
31.19
|
170.47
|
| Min moonDistance |
All sky i band |
31.62
|
37.76
|
12.63
|
0
|
547
|
33538
|
12.43
|
170.47
|
| Max moonDistance |
All sky z band |
158.10
|
153.37
|
20.39
|
83
|
0
|
33510
|
32.73
|
179.82
|
| Median moonDistance |
All sky z band |
74.08
|
75.57
|
11.42
|
12
|
445
|
33510
|
32.73
|
166.30
|
| Min moonDistance |
All sky z band |
31.02
|
37.35
|
12.65
|
0
|
667
|
33510
|
10.28
|
166.30
|
| Max moonDistance |
All sky y band |
143.19
|
138.71
|
24.84
|
112
|
0
|
29952
|
30.95
|
179.78
|
| Median moonDistance |
All sky y band |
55.97
|
58.22
|
10.50
|
0
|
584
|
29952
|
30.95
|
151.77
|
| Min moonDistance |
All sky y band |
30.38
|
37.30
|
12.95
|
0
|
574
|
29952
|
10.38
|
132.11
|
|
Group: Moondistance; Subgroup: All sky; Slicer: UniSlicer
|
| |
25th%ile moonDistance |
75th%ile moonDistance |
Count moonDistance |
Max moonDistance |
Mean moonDistance |
Median moonDistance |
Min moonDistance |
N(+3Sigma) moonDistance |
N(-3Sigma) moonDistance |
Rms moonDistance |
| All sky all bands |
61.41
|
122.32
|
2147095
|
179.90
|
92.66
|
89.37
|
10.28
|
0
|
0
|
37.55
|
| All sky g band |
86.01
|
135.18
|
196987
|
179.81
|
110.17
|
111.18
|
12.51
|
0
|
10
|
32.35
|
| All sky i band |
64.17
|
123.90
|
500895
|
179.90
|
94.50
|
91.35
|
12.43
|
0
|
0
|
37.10
|
| All sky r band |
81.82
|
134.56
|
489465
|
179.90
|
107.56
|
108.58
|
12.35
|
0
|
0
|
34.25
|
| All sky u band |
99.37
|
141.27
|
124477
|
179.73
|
118.89
|
121.04
|
12.31
|
0
|
38
|
29.72
|
| All sky y band |
44.66
|
79.98
|
394073
|
179.78
|
65.23
|
60.03
|
10.38
|
5592
|
0
|
26.51
|
| All sky z band |
53.96
|
107.51
|
441198
|
179.82
|
83.32
|
76.69
|
10.28
|
0
|
0
|
36.23
|
Group: Moondistance; Subgroup: WFD
Max moonDistance
HealpixSubsetSlicer
WFD all bands
Map of Max moonDistance for WFD all bands.
Max moonDistance
HealpixSubsetSlicer
WFD u band
Map of Max moonDistance for WFD u band.
Max moonDistance
HealpixSubsetSlicer
WFD g band
Map of Max moonDistance for WFD g band.
Max moonDistance
HealpixSubsetSlicer
WFD r band
Map of Max moonDistance for WFD r band.
Max moonDistance
HealpixSubsetSlicer
WFD i band
Map of Max moonDistance for WFD i band.
Max moonDistance
HealpixSubsetSlicer
WFD z band
Map of Max moonDistance for WFD z band.
Max moonDistance
HealpixSubsetSlicer
WFD y band
Map of Max moonDistance for WFD y band.
Median moonDistance
HealpixSubsetSlicer
WFD all bands
Map of Median moonDistance for WFD all bands.
Median moonDistance
HealpixSubsetSlicer
WFD u band
Map of Median moonDistance for WFD u band.
Median moonDistance
HealpixSubsetSlicer
WFD g band
Map of Median moonDistance for WFD g band.
Median moonDistance
HealpixSubsetSlicer
WFD r band
Map of Median moonDistance for WFD r band.
Median moonDistance
HealpixSubsetSlicer
WFD i band
Map of Median moonDistance for WFD i band.
Median moonDistance
HealpixSubsetSlicer
WFD z band
Map of Median moonDistance for WFD z band.
Median moonDistance
HealpixSubsetSlicer
WFD y band
Map of Median moonDistance for WFD y band.
Min moonDistance
HealpixSubsetSlicer
WFD all bands
Map of Min moonDistance for WFD all bands.
Min moonDistance
HealpixSubsetSlicer
WFD u band
Map of Min moonDistance for WFD u band.
Min moonDistance
HealpixSubsetSlicer
WFD g band
Map of Min moonDistance for WFD g band.
Min moonDistance
HealpixSubsetSlicer
WFD r band
Map of Min moonDistance for WFD r band.
Min moonDistance
HealpixSubsetSlicer
WFD i band
Map of Min moonDistance for WFD i band.
Min moonDistance
HealpixSubsetSlicer
WFD z band
Map of Min moonDistance for WFD z band.
Min moonDistance
HealpixSubsetSlicer
WFD y band
Map of Min moonDistance for WFD y band.
moonDistance Histogram
OneDSlicer
WFD all bands
Histogram of moonDistance for WFD all bands.
moonDistance Histogram
OneDSlicer
WFD u band
Histogram of moonDistance for WFD u band.
moonDistance Histogram
OneDSlicer
WFD g band
Histogram of moonDistance for WFD g band.
moonDistance Histogram
OneDSlicer
WFD r band
Histogram of moonDistance for WFD r band.
moonDistance Histogram
OneDSlicer
WFD i band
Histogram of moonDistance for WFD i band.
moonDistance Histogram
OneDSlicer
WFD z band
Histogram of moonDistance for WFD z band.
moonDistance Histogram
OneDSlicer
WFD y band
Histogram of moonDistance for WFD y band.
|
Group: Moondistance; Subgroup: WFD; Slicer: HealpixSubsetSlicer
|
| Metric Name |
Info Label |
Median |
Mean |
Rms |
N(-3Sigma) |
N(+3Sigma) |
Count |
Min |
Max |
| Max moonDistance |
WFD all bands |
159.99
|
155.76
|
19.70
|
0
|
0
|
22469
|
97.07
|
179.90
|
| Median moonDistance |
WFD all bands |
88.35
|
88.70
|
4.91
|
3
|
29
|
22469
|
72.70
|
114.07
|
| Min moonDistance |
WFD all bands |
29.58
|
35.68
|
12.05
|
0
|
582
|
22469
|
10.28
|
84.03
|
| Max moonDistance |
WFD u band |
157.60
|
154.02
|
19.31
|
6
|
0
|
22469
|
94.97
|
179.73
|
| Median moonDistance |
WFD u band |
126.73
|
125.17
|
11.86
|
210
|
0
|
22469
|
81.65
|
158.58
|
| Min moonDistance |
WFD u band |
49.64
|
51.05
|
13.00
|
0
|
9
|
22469
|
12.31
|
94.30
|
| Max moonDistance |
WFD g band |
158.05
|
154.23
|
19.35
|
2
|
0
|
22469
|
95.71
|
179.81
|
| Median moonDistance |
WFD g band |
115.87
|
115.12
|
9.29
|
23
|
1
|
22469
|
76.31
|
144.30
|
| Min moonDistance |
WFD g band |
43.40
|
45.45
|
11.59
|
0
|
184
|
22469
|
12.51
|
86.64
|
| Max moonDistance |
WFD r band |
159.62
|
155.35
|
19.60
|
0
|
0
|
22469
|
96.85
|
179.90
|
| Median moonDistance |
WFD r band |
113.13
|
112.34
|
8.35
|
16
|
17
|
22469
|
78.62
|
142.06
|
| Min moonDistance |
WFD r band |
33.71
|
38.63
|
11.71
|
0
|
541
|
22469
|
12.35
|
84.41
|
| Max moonDistance |
WFD i band |
159.30
|
154.96
|
19.65
|
0
|
0
|
22469
|
96.61
|
179.90
|
| Median moonDistance |
WFD i band |
90.97
|
91.76
|
7.69
|
1
|
28
|
22469
|
68.66
|
125.26
|
| Min moonDistance |
WFD i band |
30.72
|
36.52
|
11.96
|
0
|
599
|
22469
|
12.43
|
84.34
|
| Max moonDistance |
WFD z band |
157.96
|
153.84
|
19.64
|
0
|
0
|
22469
|
96.59
|
179.82
|
| Median moonDistance |
WFD z band |
73.24
|
73.68
|
7.44
|
38
|
42
|
22469
|
48.70
|
116.56
|
| Min moonDistance |
WFD z band |
30.20
|
36.16
|
12.04
|
0
|
581
|
22469
|
10.28
|
84.53
|
| Max moonDistance |
WFD y band |
148.55
|
145.20
|
20.27
|
0
|
0
|
22469
|
94.18
|
179.78
|
| Median moonDistance |
WFD y band |
56.03
|
57.81
|
9.12
|
0
|
450
|
22469
|
38.74
|
96.15
|
| Min moonDistance |
WFD y band |
29.97
|
36.03
|
12.12
|
0
|
571
|
22469
|
10.38
|
87.20
|
|
Group: Moondistance; Subgroup: WFD; Slicer: UniSlicer
|
| |
25th%ile moonDistance |
75th%ile moonDistance |
Count moonDistance |
Max moonDistance |
Mean moonDistance |
Median moonDistance |
Min moonDistance |
N(+3Sigma) moonDistance |
N(-3Sigma) moonDistance |
Rms moonDistance |
| WFD all bands |
61.41
|
122.32
|
2147095
|
179.90
|
92.66
|
89.37
|
10.28
|
0
|
0
|
37.55
|
| WFD g band |
86.01
|
135.18
|
196987
|
179.81
|
110.17
|
111.18
|
12.51
|
0
|
10
|
32.35
|
| WFD i band |
64.17
|
123.90
|
500895
|
179.90
|
94.50
|
91.35
|
12.43
|
0
|
0
|
37.10
|
| WFD r band |
81.82
|
134.56
|
489465
|
179.90
|
107.56
|
108.58
|
12.35
|
0
|
0
|
34.25
|
| WFD u band |
99.37
|
141.27
|
124477
|
179.73
|
118.89
|
121.04
|
12.31
|
0
|
38
|
29.72
|
| WFD y band |
44.66
|
79.98
|
394073
|
179.78
|
65.23
|
60.03
|
10.38
|
5592
|
0
|
26.51
|
| WFD z band |
53.96
|
107.51
|
441198
|
179.82
|
83.32
|
76.69
|
10.28
|
0
|
0
|
36.23
|
Group: Normairmass; Subgroup: All sky
Max normairmass
HealpixSlicer
All sky all bands
Map of Max normairmass for All sky all bands.
Max normairmass
HealpixSlicer
All sky u band
Map of Max normairmass for All sky u band.
Max normairmass
HealpixSlicer
All sky g band
Map of Max normairmass for All sky g band.
Max normairmass
HealpixSlicer
All sky r band
Map of Max normairmass for All sky r band.
Max normairmass
HealpixSlicer
All sky i band
Map of Max normairmass for All sky i band.
Max normairmass
HealpixSlicer
All sky z band
Map of Max normairmass for All sky z band.
Max normairmass
HealpixSlicer
All sky y band
Map of Max normairmass for All sky y band.
Median normairmass
HealpixSlicer
All sky all bands
Map of Median normairmass for All sky all bands.
Median normairmass
HealpixSlicer
All sky u band
Map of Median normairmass for All sky u band.
Median normairmass
HealpixSlicer
All sky g band
Map of Median normairmass for All sky g band.
Median normairmass
HealpixSlicer
All sky r band
Map of Median normairmass for All sky r band.
Median normairmass
HealpixSlicer
All sky i band
Map of Median normairmass for All sky i band.
Median normairmass
HealpixSlicer
All sky z band
Map of Median normairmass for All sky z band.
Median normairmass
HealpixSlicer
All sky y band
Map of Median normairmass for All sky y band.
Min normairmass
HealpixSlicer
All sky all bands
Map of Min normairmass for All sky all bands.
Min normairmass
HealpixSlicer
All sky u band
Map of Min normairmass for All sky u band.
Min normairmass
HealpixSlicer
All sky g band
Map of Min normairmass for All sky g band.
Min normairmass
HealpixSlicer
All sky r band
Map of Min normairmass for All sky r band.
Min normairmass
HealpixSlicer
All sky i band
Map of Min normairmass for All sky i band.
Min normairmass
HealpixSlicer
All sky z band
Map of Min normairmass for All sky z band.
Min normairmass
HealpixSlicer
All sky y band
Map of Min normairmass for All sky y band.
normairmass Histogram
OneDSlicer
All sky all bands
Histogram of normairmass for All sky all bands.
normairmass Histogram
OneDSlicer
All sky u band
Histogram of normairmass for All sky u band.
normairmass Histogram
OneDSlicer
All sky g band
Histogram of normairmass for All sky g band.
normairmass Histogram
OneDSlicer
All sky r band
Histogram of normairmass for All sky r band.
normairmass Histogram
OneDSlicer
All sky i band
Histogram of normairmass for All sky i band.
normairmass Histogram
OneDSlicer
All sky z band
Histogram of normairmass for All sky z band.
normairmass Histogram
OneDSlicer
All sky y band
Histogram of normairmass for All sky y band.
|
Group: Normairmass; Subgroup: All sky; Slicer: HealpixSlicer
|
| Metric Name |
Info Label |
Median |
Mean |
Rms |
N(-3Sigma) |
N(+3Sigma) |
Count |
Min |
Max |
| Max normairmass |
All sky all bands |
2.36
|
2.29
|
0.40
|
69
|
0
|
33578
|
1.00
|
2.92
|
| Median normairmass |
All sky all bands |
1.06
|
1.08
|
0.05
|
0
|
71
|
33578
|
1.00
|
1.27
|
| Min normairmass |
All sky all bands |
1.00
|
1.00
|
0.0091
|
0
|
203
|
33578
|
1.00
|
1.18
|
| Max normairmass |
All sky u band |
1.61
|
1.65
|
0.30
|
0
|
233
|
29864
|
1.00
|
2.81
|
| Median normairmass |
All sky u band |
1.07
|
1.08
|
0.05
|
0
|
183
|
29864
|
1.00
|
1.83
|
| Min normairmass |
All sky u band |
1.00
|
1.01
|
0.0193
|
0
|
187
|
29864
|
1.00
|
1.60
|
| Max normairmass |
All sky g band |
1.74
|
1.73
|
0.27
|
0
|
92
|
33481
|
1.00
|
2.75
|
| Median normairmass |
All sky g band |
1.06
|
1.08
|
0.05
|
0
|
267
|
33481
|
1.00
|
1.67
|
| Min normairmass |
All sky g band |
1.00
|
1.01
|
0.0161
|
0
|
225
|
33481
|
1.00
|
1.67
|
| Max normairmass |
All sky r band |
2.00
|
1.98
|
0.36
|
0
|
0
|
33540
|
1.00
|
2.88
|
| Median normairmass |
All sky r band |
1.06
|
1.07
|
0.05
|
0
|
109
|
33540
|
1.00
|
1.70
|
| Min normairmass |
All sky r band |
1.00
|
1.01
|
0.0122
|
0
|
146
|
33540
|
1.00
|
1.62
|
| Max normairmass |
All sky i band |
2.15
|
2.12
|
0.43
|
0
|
0
|
33538
|
1.00
|
2.91
|
| Median normairmass |
All sky i band |
1.06
|
1.08
|
0.05
|
0
|
313
|
33538
|
1.00
|
1.56
|
| Min normairmass |
All sky i band |
1.00
|
1.01
|
0.0118
|
0
|
211
|
33538
|
1.00
|
1.31
|
| Max normairmass |
All sky z band |
2.17
|
2.14
|
0.43
|
0
|
0
|
33510
|
1.00
|
2.92
|
| Median normairmass |
All sky z band |
1.07
|
1.09
|
0.06
|
0
|
392
|
33510
|
1.00
|
1.92
|
| Min normairmass |
All sky z band |
1.00
|
1.01
|
0.0132
|
0
|
204
|
33510
|
1.00
|
1.64
|
| Max normairmass |
All sky y band |
2.06
|
2.04
|
0.34
|
24
|
0
|
29952
|
1.00
|
2.92
|
| Median normairmass |
All sky y band |
1.07
|
1.09
|
0.05
|
0
|
99
|
29952
|
1.00
|
2.08
|
| Min normairmass |
All sky y band |
1.00
|
1.01
|
0.0170
|
0
|
111
|
29952
|
1.00
|
2.08
|
|
Group: Normairmass; Subgroup: All sky; Slicer: UniSlicer
|
| |
25th%ile normairmass |
75th%ile normairmass |
Count normairmass |
Max normairmass |
Mean normairmass |
Median normairmass |
Min normairmass |
N(+3Sigma) normairmass |
N(-3Sigma) normairmass |
Rms normairmass |
| All sky all bands |
1.02
|
1.20
|
2147095
|
2.92
|
1.17
|
1.08
|
1.00
|
68275
|
0
|
0.25
|
| All sky g band |
1.02
|
1.19
|
196987
|
2.75
|
1.15
|
1.08
|
1.00
|
4925
|
0
|
0.20
|
| All sky i band |
1.02
|
1.19
|
500895
|
2.91
|
1.18
|
1.08
|
1.00
|
17983
|
0
|
0.28
|
| All sky r band |
1.02
|
1.19
|
489465
|
2.88
|
1.16
|
1.08
|
1.00
|
16842
|
0
|
0.24
|
| All sky u band |
1.02
|
1.17
|
124477
|
2.81
|
1.13
|
1.08
|
1.00
|
2792
|
0
|
0.17
|
| All sky y band |
1.03
|
1.20
|
394073
|
2.92
|
1.16
|
1.09
|
1.00
|
9430
|
0
|
0.20
|
| All sky z band |
1.03
|
1.22
|
441198
|
2.92
|
1.20
|
1.09
|
1.00
|
15029
|
0
|
0.29
|
Group: Normairmass; Subgroup: WFD
Max normairmass
HealpixSubsetSlicer
WFD all bands
Map of Max normairmass for WFD all bands.
Max normairmass
HealpixSubsetSlicer
WFD u band
Map of Max normairmass for WFD u band.
Max normairmass
HealpixSubsetSlicer
WFD g band
Map of Max normairmass for WFD g band.
Max normairmass
HealpixSubsetSlicer
WFD r band
Map of Max normairmass for WFD r band.
Max normairmass
HealpixSubsetSlicer
WFD i band
Map of Max normairmass for WFD i band.
Max normairmass
HealpixSubsetSlicer
WFD z band
Map of Max normairmass for WFD z band.
Max normairmass
HealpixSubsetSlicer
WFD y band
Map of Max normairmass for WFD y band.
Median normairmass
HealpixSubsetSlicer
WFD all bands
Map of Median normairmass for WFD all bands.
Median normairmass
HealpixSubsetSlicer
WFD u band
Map of Median normairmass for WFD u band.
Median normairmass
HealpixSubsetSlicer
WFD g band
Map of Median normairmass for WFD g band.
Median normairmass
HealpixSubsetSlicer
WFD r band
Map of Median normairmass for WFD r band.
Median normairmass
HealpixSubsetSlicer
WFD i band
Map of Median normairmass for WFD i band.
Median normairmass
HealpixSubsetSlicer
WFD z band
Map of Median normairmass for WFD z band.
Median normairmass
HealpixSubsetSlicer
WFD y band
Map of Median normairmass for WFD y band.
Min normairmass
HealpixSubsetSlicer
WFD all bands
Map of Min normairmass for WFD all bands.
Min normairmass
HealpixSubsetSlicer
WFD u band
Map of Min normairmass for WFD u band.
Min normairmass
HealpixSubsetSlicer
WFD g band
Map of Min normairmass for WFD g band.
Min normairmass
HealpixSubsetSlicer
WFD r band
Map of Min normairmass for WFD r band.
Min normairmass
HealpixSubsetSlicer
WFD i band
Map of Min normairmass for WFD i band.
Min normairmass
HealpixSubsetSlicer
WFD z band
Map of Min normairmass for WFD z band.
Min normairmass
HealpixSubsetSlicer
WFD y band
Map of Min normairmass for WFD y band.
normairmass Histogram
OneDSlicer
WFD all bands
Histogram of normairmass for WFD all bands.
normairmass Histogram
OneDSlicer
WFD u band
Histogram of normairmass for WFD u band.
normairmass Histogram
OneDSlicer
WFD g band
Histogram of normairmass for WFD g band.
normairmass Histogram
OneDSlicer
WFD r band
Histogram of normairmass for WFD r band.
normairmass Histogram
OneDSlicer
WFD i band
Histogram of normairmass for WFD i band.
normairmass Histogram
OneDSlicer
WFD z band
Histogram of normairmass for WFD z band.
normairmass Histogram
OneDSlicer
WFD y band
Histogram of normairmass for WFD y band.
|
Group: Normairmass; Subgroup: WFD; Slicer: HealpixSubsetSlicer
|
| Metric Name |
Info Label |
Median |
Mean |
Rms |
N(-3Sigma) |
N(+3Sigma) |
Count |
Min |
Max |
| Max normairmass |
WFD all bands |
2.47
|
2.45
|
0.27
|
11
|
0
|
22469
|
1.60
|
2.92
|
| Median normairmass |
WFD all bands |
1.06
|
1.08
|
0.04
|
0
|
0
|
22469
|
1.01
|
1.20
|
| Min normairmass |
WFD all bands |
1.00
|
1.01
|
0.0092
|
0
|
5
|
22469
|
1.00
|
1.03
|
| Max normairmass |
WFD u band |
1.66
|
1.71
|
0.29
|
0
|
164
|
22469
|
1.08
|
2.78
|
| Median normairmass |
WFD u band |
1.07
|
1.08
|
0.05
|
0
|
81
|
22469
|
1.01
|
1.30
|
| Min normairmass |
WFD u band |
1.00
|
1.01
|
0.0165
|
0
|
62
|
22469
|
1.00
|
1.09
|
| Max normairmass |
WFD g band |
1.82
|
1.82
|
0.23
|
1
|
107
|
22469
|
1.13
|
2.75
|
| Median normairmass |
WFD g band |
1.07
|
1.08
|
0.05
|
0
|
26
|
22469
|
1.00
|
1.26
|
| Min normairmass |
WFD g band |
1.00
|
1.01
|
0.0153
|
0
|
48
|
22469
|
1.00
|
1.08
|
| Max normairmass |
WFD r band |
2.13
|
2.10
|
0.29
|
1
|
0
|
22469
|
1.23
|
2.88
|
| Median normairmass |
WFD r band |
1.06
|
1.08
|
0.05
|
0
|
0
|
22469
|
1.01
|
1.21
|
| Min normairmass |
WFD r band |
1.00
|
1.01
|
0.0109
|
0
|
42
|
22469
|
1.00
|
1.05
|
| Max normairmass |
WFD i band |
2.28
|
2.27
|
0.33
|
0
|
0
|
22469
|
1.32
|
2.91
|
| Median normairmass |
WFD i band |
1.06
|
1.08
|
0.04
|
0
|
2
|
22469
|
1.00
|
1.22
|
| Min normairmass |
WFD i band |
1.00
|
1.01
|
0.0110
|
0
|
18
|
22469
|
1.00
|
1.05
|
| Max normairmass |
WFD z band |
2.32
|
2.30
|
0.33
|
0
|
0
|
22469
|
1.37
|
2.92
|
| Median normairmass |
WFD z band |
1.07
|
1.09
|
0.05
|
0
|
0
|
22469
|
1.01
|
1.23
|
| Min normairmass |
WFD z band |
1.00
|
1.01
|
0.0112
|
0
|
61
|
22469
|
1.00
|
1.05
|
| Max normairmass |
WFD y band |
2.13
|
2.13
|
0.28
|
5
|
0
|
22469
|
1.23
|
2.92
|
| Median normairmass |
WFD y band |
1.08
|
1.09
|
0.04
|
0
|
5
|
22469
|
1.01
|
1.24
|
| Min normairmass |
WFD y band |
1.00
|
1.01
|
0.0130
|
0
|
69
|
22469
|
1.00
|
1.07
|
|
Group: Normairmass; Subgroup: WFD; Slicer: UniSlicer
|
| |
25th%ile normairmass |
75th%ile normairmass |
Count normairmass |
Max normairmass |
Mean normairmass |
Median normairmass |
Min normairmass |
N(+3Sigma) normairmass |
N(-3Sigma) normairmass |
Rms normairmass |
| WFD all bands |
1.02
|
1.20
|
2147095
|
2.92
|
1.17
|
1.08
|
1.00
|
68275
|
0
|
0.25
|
| WFD g band |
1.02
|
1.19
|
196987
|
2.75
|
1.15
|
1.08
|
1.00
|
4925
|
0
|
0.20
|
| WFD i band |
1.02
|
1.19
|
500895
|
2.91
|
1.18
|
1.08
|
1.00
|
17983
|
0
|
0.28
|
| WFD r band |
1.02
|
1.19
|
489465
|
2.88
|
1.16
|
1.08
|
1.00
|
16842
|
0
|
0.24
|
| WFD u band |
1.02
|
1.17
|
124477
|
2.81
|
1.13
|
1.08
|
1.00
|
2792
|
0
|
0.17
|
| WFD y band |
1.03
|
1.20
|
394073
|
2.92
|
1.16
|
1.09
|
1.00
|
9430
|
0
|
0.20
|
| WFD z band |
1.03
|
1.22
|
441198
|
2.92
|
1.20
|
1.09
|
1.00
|
15029
|
0
|
0.29
|
Group: Nvisit Summary; Subgroup: All visits
|
Group: Nvisit Summary; Subgroup: All visits; Slicer: UniSlicer
|
| |
Nvisits |
| All visits |
2147095.00
|
Group: Nvisit Summary; Subgroup: DDF
|
Group: Nvisit Summary; Subgroup: DDF; Slicer: UniSlicer
|
| |
Nvisits |
| DDF |
128080.00
|
Group: Nvisit Summary; Subgroup: WFD
|
Group: Nvisit Summary; Subgroup: WFD; Slicer: UniSlicer
|
| |
Nvisits |
| WFD |
1735539.00
|
Group: Nvisits Maps; Subgroup: All sky
NVisits
HealpixSlicer
All sky all bands
Number of visits per healpix in All sky all bands.
NVisits
HealpixSlicer
All sky u band
Number of visits per healpix in All sky u band.
NVisits
HealpixSlicer
All sky g band
Number of visits per healpix in All sky g band.
NVisits
HealpixSlicer
All sky r band
Number of visits per healpix in All sky r band.
NVisits
HealpixSlicer
All sky i band
Number of visits per healpix in All sky i band.
NVisits
HealpixSlicer
All sky z band
Number of visits per healpix in All sky z band.
NVisits
HealpixSlicer
All sky y band
Number of visits per healpix in All sky y band.
|
Group: Nvisits Maps; Subgroup: All sky; Slicer: HealpixSlicer
|
| Metric Name |
Info Label |
Median |
Mean |
Rms |
N(-3Sigma) |
N(+3Sigma) |
Count |
Min |
Max |
| NVisits |
All sky all bands |
818.00
|
697.86
|
920.93
|
0
|
104
|
33578
|
1.00
|
36948.00
|
| NVisits |
All sky u band |
51.00
|
45.50
|
44.39
|
0
|
102
|
29864
|
1.00
|
1811.00
|
| NVisits |
All sky g band |
67.00
|
64.18
|
102.34
|
0
|
101
|
33481
|
1.00
|
4259.00
|
| NVisits |
All sky r band |
180.00
|
159.24
|
207.92
|
0
|
104
|
33540
|
1.00
|
8394.00
|
| NVisits |
All sky i band |
186.00
|
162.99
|
209.35
|
0
|
103
|
33538
|
1.00
|
8498.00
|
| NVisits |
All sky z band |
162.00
|
143.69
|
236.91
|
0
|
104
|
33510
|
1.00
|
9686.00
|
| NVisits |
All sky y band |
163.00
|
143.66
|
127.60
|
0
|
99
|
29952
|
1.00
|
4461.00
|
Group: Nvisits Maps; Subgroup: WFD
NVisits
HealpixSubsetSlicer
WFD all bands
Number of visits per healpix in WFD all bands.
NVisits
HealpixSubsetSlicer
WFD u band
Number of visits per healpix in WFD u band.
NVisits
HealpixSubsetSlicer
WFD g band
Number of visits per healpix in WFD g band.
NVisits
HealpixSubsetSlicer
WFD r band
Number of visits per healpix in WFD r band.
NVisits
HealpixSubsetSlicer
WFD i band
Number of visits per healpix in WFD i band.
NVisits
HealpixSubsetSlicer
WFD z band
Number of visits per healpix in WFD z band.
NVisits
HealpixSubsetSlicer
WFD y band
Number of visits per healpix in WFD y band.
|
Group: Nvisits Maps; Subgroup: WFD; Slicer: HealpixSubsetSlicer
|
| Metric Name |
Info Label |
Median |
Mean |
Rms |
N(-3Sigma) |
N(+3Sigma) |
Count |
Min |
Max |
| NVisits |
WFD all bands |
840.00
|
902.77
|
1057.43
|
0
|
95
|
22469
|
751.00
|
36948.00
|
| NVisits |
WFD u band |
53.00
|
54.59
|
47.17
|
0
|
98
|
22469
|
18.00
|
1811.00
|
| NVisits |
WFD g band |
70.00
|
78.88
|
121.41
|
0
|
97
|
22469
|
44.00
|
4259.00
|
| NVisits |
WFD r band |
186.00
|
202.77
|
239.89
|
0
|
95
|
22469
|
153.00
|
8394.00
|
| NVisits |
WFD i band |
193.00
|
207.67
|
241.32
|
0
|
96
|
22469
|
153.00
|
8498.00
|
| NVisits |
WFD z band |
170.00
|
186.40
|
277.68
|
0
|
99
|
22469
|
124.00
|
9686.00
|
| NVisits |
WFD y band |
168.00
|
172.45
|
133.40
|
0
|
96
|
22469
|
77.00
|
4461.00
|
Group: Nvisits Maps; Subgroup: Yr 1
NVisits
HealpixSlicer
Yr 1 all bands
Number of visits per healpix in Yr 1 all bands.
NVisits
HealpixSlicer
Yr 1 u band
Number of visits per healpix in Yr 1 u band.
NVisits
HealpixSlicer
Yr 1 g band
Number of visits per healpix in Yr 1 g band.
NVisits
HealpixSlicer
Yr 1 r band
Number of visits per healpix in Yr 1 r band.
NVisits
HealpixSlicer
Yr 1 i band
Number of visits per healpix in Yr 1 i band.
NVisits
HealpixSlicer
Yr 1 z band
Number of visits per healpix in Yr 1 z band.
NVisits
HealpixSlicer
Yr 1 y band
Number of visits per healpix in Yr 1 y band.
|
Group: Nvisits Maps; Subgroup: Yr 1; Slicer: HealpixSlicer
|
| Metric Name |
Info Label |
Median |
Mean |
Rms |
N(-3Sigma) |
N(+3Sigma) |
Count |
Min |
Max |
| NVisits |
Yr 1 all bands |
85.00
|
79.08
|
146.00
|
0
|
82
|
33393
|
1.00
|
8467.00
|
| NVisits |
Yr 1 u band |
6.00
|
6.23
|
7.98
|
0
|
69
|
29487
|
1.00
|
437.00
|
| NVisits |
Yr 1 g band |
7.00
|
7.71
|
16.58
|
0
|
79
|
33183
|
1.00
|
945.00
|
| NVisits |
Yr 1 r band |
17.00
|
16.64
|
33.16
|
0
|
80
|
33246
|
1.00
|
1913.00
|
| NVisits |
Yr 1 i band |
19.00
|
18.41
|
33.39
|
0
|
83
|
33311
|
1.00
|
1947.00
|
| NVisits |
Yr 1 z band |
15.00
|
14.89
|
37.99
|
0
|
84
|
33255
|
1.00
|
2237.00
|
| NVisits |
Yr 1 y band |
19.00
|
18.18
|
19.28
|
0
|
74
|
29670
|
1.00
|
1012.00
|
Group: Nvisits Maps; Subgroup: Yr 3-4
NVisits
HealpixSlicer
Yr 3-4 all bands
Number of visits per healpix in Yr 3-4 all bands.
NVisits
HealpixSlicer
Yr 3-4 u band
Number of visits per healpix in Yr 3-4 u band.
NVisits
HealpixSlicer
Yr 3-4 g band
Number of visits per healpix in Yr 3-4 g band.
NVisits
HealpixSlicer
Yr 3-4 r band
Number of visits per healpix in Yr 3-4 r band.
NVisits
HealpixSlicer
Yr 3-4 i band
Number of visits per healpix in Yr 3-4 i band.
NVisits
HealpixSlicer
Yr 3-4 z band
Number of visits per healpix in Yr 3-4 z band.
NVisits
HealpixSlicer
Yr 3-4 y band
Number of visits per healpix in Yr 3-4 y band.
|
Group: Nvisits Maps; Subgroup: Yr 3-4; Slicer: HealpixSlicer
|
| Metric Name |
Info Label |
Median |
Mean |
Rms |
N(-3Sigma) |
N(+3Sigma) |
Count |
Min |
Max |
| NVisits |
Yr 3-4 all bands |
53.00
|
61.62
|
41.92
|
0
|
0
|
33343
|
1.00
|
180.00
|
| NVisits |
Yr 3-4 u band |
4.00
|
4.46
|
2.96
|
0
|
58
|
25293
|
1.00
|
18.00
|
| NVisits |
Yr 3-4 g band |
5.00
|
5.44
|
3.38
|
0
|
106
|
31207
|
1.00
|
20.00
|
| NVisits |
Yr 3-4 r band |
12.00
|
13.71
|
9.14
|
0
|
8
|
32828
|
1.00
|
46.00
|
| NVisits |
Yr 3-4 i band |
12.00
|
14.47
|
9.88
|
0
|
6
|
33071
|
1.00
|
47.00
|
| NVisits |
Yr 3-4 z band |
12.00
|
13.55
|
9.33
|
0
|
15
|
32970
|
1.00
|
53.00
|
| NVisits |
Yr 3-4 y band |
12.00
|
13.66
|
9.00
|
0
|
7
|
29027
|
1.00
|
44.00
|
Group: Nvisits Per Night; Subgroup: All visits
Nvisits
OneDSlicer
All visits
Number of visits per night for All visits.
|
Group: Nvisits Per Night; Subgroup: All visits; Slicer: OneDSlicer
|
|
|
|
|
| Median |
785.00
|
| Mean |
764.27
|
| Rms |
218.60
|
| N(-3Sigma) |
0
|
| N(+3Sigma) |
0
|
| Count |
2808
|
| Min |
131.00
|
| Max |
1093.00
|
Group: Nvisits Per Night; Subgroup: DDF
Nvisits
OneDSlicer
DDF
Number of visits per night for DDF.
|
Group: Nvisits Per Night; Subgroup: DDF; Slicer: OneDSlicer
|
|
|
|
|
| Median |
92.00
|
| Mean |
108.93
|
| Rms |
65.02
|
| N(-3Sigma) |
0
|
| N(+3Sigma) |
20
|
| Count |
1175
|
| Min |
1.00
|
| Max |
552.00
|
Group: Open Shutter Fraction; Subgroup: All visits
|
Group: Open Shutter Fraction; Subgroup: All visits; Slicer: UniSlicer
|
| |
CountUnique night |
FullRange night |
OpenShutterFraction |
| All visits |
2809
|
3652.00
|
0.72
|
Group: Open Shutter Fraction; Subgroup: Per night
OpenShutterFraction
OneDSlicer
Per night
Open shutter fraction per night. This compares on-sky image time against on-sky time + slews + filter changes + readout, but does not include downtime due to weather.
|
Group: Open Shutter Fraction; Subgroup: Per night; Slicer: OneDSlicer
|
|
|
|
|
| Median |
0.72
|
| Mean |
0.72
|
| Rms |
0.0134
|
| N(-3Sigma) |
22
|
| N(+3Sigma) |
2
|
| Count |
2808
|
| Min |
0.66
|
| Max |
0.77
|
Group: Rotskypos; Subgroup: All sky
AngleMean rotSkyPos
HealpixSlicer
All sky all bands
Map of AngleMean rotSkyPos for All sky all bands.
AngleMean rotSkyPos
HealpixSlicer
All sky u band
Map of AngleMean rotSkyPos for All sky u band.
AngleMean rotSkyPos
HealpixSlicer
All sky g band
Map of AngleMean rotSkyPos for All sky g band.
AngleMean rotSkyPos
HealpixSlicer
All sky r band
Map of AngleMean rotSkyPos for All sky r band.
AngleMean rotSkyPos
HealpixSlicer
All sky i band
Map of AngleMean rotSkyPos for All sky i band.
AngleMean rotSkyPos
HealpixSlicer
All sky z band
Map of AngleMean rotSkyPos for All sky z band.
AngleMean rotSkyPos
HealpixSlicer
All sky y band
Map of AngleMean rotSkyPos for All sky y band.
AngleRange rotSkyPos
HealpixSlicer
All sky all bands
Map of AngleRange rotSkyPos for All sky all bands.
AngleRange rotSkyPos
HealpixSlicer
All sky u band
Map of AngleRange rotSkyPos for All sky u band.
AngleRange rotSkyPos
HealpixSlicer
All sky g band
Map of AngleRange rotSkyPos for All sky g band.
AngleRange rotSkyPos
HealpixSlicer
All sky r band
Map of AngleRange rotSkyPos for All sky r band.
AngleRange rotSkyPos
HealpixSlicer
All sky i band
Map of AngleRange rotSkyPos for All sky i band.
AngleRange rotSkyPos
HealpixSlicer
All sky z band
Map of AngleRange rotSkyPos for All sky z band.
AngleRange rotSkyPos
HealpixSlicer
All sky y band
Map of AngleRange rotSkyPos for All sky y band.
AngleRms rotSkyPos
HealpixSlicer
All sky all bands
Map of AngleRms rotSkyPos for All sky all bands.
AngleRms rotSkyPos
HealpixSlicer
All sky u band
Map of AngleRms rotSkyPos for All sky u band.
AngleRms rotSkyPos
HealpixSlicer
All sky g band
Map of AngleRms rotSkyPos for All sky g band.
AngleRms rotSkyPos
HealpixSlicer
All sky r band
Map of AngleRms rotSkyPos for All sky r band.
AngleRms rotSkyPos
HealpixSlicer
All sky i band
Map of AngleRms rotSkyPos for All sky i band.
AngleRms rotSkyPos
HealpixSlicer
All sky z band
Map of AngleRms rotSkyPos for All sky z band.
AngleRms rotSkyPos
HealpixSlicer
All sky y band
Map of AngleRms rotSkyPos for All sky y band.
rotSkyPos Histogram
OneDSlicer
All sky all bands
Histogram of rotSkyPos for All sky all bands.
rotSkyPos Histogram
OneDSlicer
All sky u band
Histogram of rotSkyPos for All sky u band.
rotSkyPos Histogram
OneDSlicer
All sky g band
Histogram of rotSkyPos for All sky g band.
rotSkyPos Histogram
OneDSlicer
All sky r band
Histogram of rotSkyPos for All sky r band.
rotSkyPos Histogram
OneDSlicer
All sky i band
Histogram of rotSkyPos for All sky i band.
rotSkyPos Histogram
OneDSlicer
All sky z band
Histogram of rotSkyPos for All sky z band.
rotSkyPos Histogram
OneDSlicer
All sky y band
Histogram of rotSkyPos for All sky y band.
|
Group: Rotskypos; Subgroup: All sky; Slicer: HealpixSlicer
|
| Metric Name |
Info Label |
Median |
Mean |
Rms |
N(-3Sigma) |
N(+3Sigma) |
Count |
Min |
Max |
| AngleMean rotSkyPos |
All sky all bands |
190.71
|
202.39
|
87.88
|
0
|
0
|
33578
|
0.0044
|
359.98
|
| AngleRange rotSkyPos |
All sky all bands |
282.70
|
280.25
|
50.36
|
179
|
0
|
33578
|
0.0000
|
355.47
|
| AngleRms rotSkyPos |
All sky all bands |
63.34
|
63.93
|
11.55
|
85
|
75
|
33578
|
0.0000
|
117.80
|
| AngleMean rotSkyPos |
All sky u band |
199.73
|
210.40
|
90.91
|
0
|
0
|
29864
|
0.0031
|
359.99
|
| AngleRange rotSkyPos |
All sky u band |
242.84
|
239.82
|
52.87
|
286
|
0
|
29864
|
0.0000
|
338.72
|
| AngleRms rotSkyPos |
All sky u band |
62.00
|
62.94
|
13.64
|
206
|
48
|
29864
|
0.0000
|
114.39
|
| AngleMean rotSkyPos |
All sky g band |
183.73
|
178.13
|
87.65
|
0
|
0
|
33481
|
0.0009
|
359.98
|
| AngleRange rotSkyPos |
All sky g band |
257.23
|
250.62
|
52.24
|
218
|
0
|
33481
|
0.0000
|
347.04
|
| AngleRms rotSkyPos |
All sky g band |
62.65
|
64.82
|
14.70
|
123
|
22
|
33481
|
0.0000
|
118.31
|
| AngleMean rotSkyPos |
All sky r band |
186.48
|
195.78
|
88.80
|
0
|
0
|
33540
|
0.0005
|
359.99
|
| AngleRange rotSkyPos |
All sky r band |
270.96
|
264.10
|
51.29
|
199
|
0
|
33540
|
0.0000
|
350.80
|
| AngleRms rotSkyPos |
All sky r band |
62.10
|
63.49
|
12.87
|
118
|
85
|
33540
|
0.0000
|
112.04
|
| AngleMean rotSkyPos |
All sky i band |
194.69
|
202.53
|
87.52
|
0
|
0
|
33538
|
0.0035
|
360.00
|
| AngleRange rotSkyPos |
All sky i band |
268.03
|
264.64
|
50.86
|
200
|
0
|
33538
|
0.0000
|
351.01
|
| AngleRms rotSkyPos |
All sky i band |
61.74
|
62.54
|
11.20
|
132
|
131
|
33538
|
0.0000
|
111.34
|
| AngleMean rotSkyPos |
All sky z band |
195.79
|
203.18
|
86.71
|
0
|
0
|
33510
|
0.0047
|
360.00
|
| AngleRange rotSkyPos |
All sky z band |
267.56
|
264.10
|
51.85
|
220
|
0
|
33510
|
0.0000
|
350.41
|
| AngleRms rotSkyPos |
All sky z band |
61.91
|
63.38
|
12.04
|
130
|
163
|
33510
|
0.0000
|
116.59
|
| AngleMean rotSkyPos |
All sky y band |
220.10
|
229.40
|
80.40
|
0
|
0
|
29952
|
0.0009
|
360.00
|
| AngleRange rotSkyPos |
All sky y band |
264.02
|
259.93
|
47.42
|
256
|
0
|
29952
|
0.0000
|
346.75
|
| AngleRms rotSkyPos |
All sky y band |
60.57
|
61.46
|
11.16
|
146
|
120
|
29952
|
0.0000
|
115.82
|
|
Group: Rotskypos; Subgroup: All sky; Slicer: UniSlicer
|
| |
FullRangeAngle rotSkyPos |
Max rotSkyPos |
MeanAngle rotSkyPos |
Min rotSkyPos |
RmsAngle rotSkyPos |
| All sky all bands |
359.99
|
360.00
|
215.97
|
0.0004
|
88.33
|
| All sky g band |
359.96
|
360.00
|
190.98
|
0.0050
|
90.67
|
| All sky i band |
359.98
|
360.00
|
217.45
|
0.0015
|
87.38
|
| All sky r band |
359.99
|
360.00
|
207.73
|
0.0004
|
91.09
|
| All sky u band |
359.95
|
360.00
|
220.74
|
0.0083
|
88.49
|
| All sky y band |
359.98
|
360.00
|
228.35
|
0.0028
|
86.08
|
| All sky z band |
359.98
|
360.00
|
217.74
|
0.0038
|
88.75
|
Group: Rotskypos; Subgroup: WFD
AngleMean rotSkyPos
HealpixSubsetSlicer
WFD all bands
Map of AngleMean rotSkyPos for WFD all bands.
AngleMean rotSkyPos
HealpixSubsetSlicer
WFD u band
Map of AngleMean rotSkyPos for WFD u band.
AngleMean rotSkyPos
HealpixSubsetSlicer
WFD g band
Map of AngleMean rotSkyPos for WFD g band.
AngleMean rotSkyPos
HealpixSubsetSlicer
WFD r band
Map of AngleMean rotSkyPos for WFD r band.
AngleMean rotSkyPos
HealpixSubsetSlicer
WFD i band
Map of AngleMean rotSkyPos for WFD i band.
AngleMean rotSkyPos
HealpixSubsetSlicer
WFD z band
Map of AngleMean rotSkyPos for WFD z band.
AngleMean rotSkyPos
HealpixSubsetSlicer
WFD y band
Map of AngleMean rotSkyPos for WFD y band.
AngleRange rotSkyPos
HealpixSubsetSlicer
WFD all bands
Map of AngleRange rotSkyPos for WFD all bands.
AngleRange rotSkyPos
HealpixSubsetSlicer
WFD u band
Map of AngleRange rotSkyPos for WFD u band.
AngleRange rotSkyPos
HealpixSubsetSlicer
WFD g band
Map of AngleRange rotSkyPos for WFD g band.
AngleRange rotSkyPos
HealpixSubsetSlicer
WFD r band
Map of AngleRange rotSkyPos for WFD r band.
AngleRange rotSkyPos
HealpixSubsetSlicer
WFD i band
Map of AngleRange rotSkyPos for WFD i band.
AngleRange rotSkyPos
HealpixSubsetSlicer
WFD z band
Map of AngleRange rotSkyPos for WFD z band.
AngleRange rotSkyPos
HealpixSubsetSlicer
WFD y band
Map of AngleRange rotSkyPos for WFD y band.
AngleRms rotSkyPos
HealpixSubsetSlicer
WFD all bands
Map of AngleRms rotSkyPos for WFD all bands.
AngleRms rotSkyPos
HealpixSubsetSlicer
WFD u band
Map of AngleRms rotSkyPos for WFD u band.
AngleRms rotSkyPos
HealpixSubsetSlicer
WFD g band
Map of AngleRms rotSkyPos for WFD g band.
AngleRms rotSkyPos
HealpixSubsetSlicer
WFD r band
Map of AngleRms rotSkyPos for WFD r band.
AngleRms rotSkyPos
HealpixSubsetSlicer
WFD i band
Map of AngleRms rotSkyPos for WFD i band.
AngleRms rotSkyPos
HealpixSubsetSlicer
WFD z band
Map of AngleRms rotSkyPos for WFD z band.
AngleRms rotSkyPos
HealpixSubsetSlicer
WFD y band
Map of AngleRms rotSkyPos for WFD y band.
rotSkyPos Histogram
OneDSlicer
WFD all bands
Histogram of rotSkyPos for WFD all bands.
rotSkyPos Histogram
OneDSlicer
WFD u band
Histogram of rotSkyPos for WFD u band.
rotSkyPos Histogram
OneDSlicer
WFD g band
Histogram of rotSkyPos for WFD g band.
rotSkyPos Histogram
OneDSlicer
WFD r band
Histogram of rotSkyPos for WFD r band.
rotSkyPos Histogram
OneDSlicer
WFD i band
Histogram of rotSkyPos for WFD i band.
rotSkyPos Histogram
OneDSlicer
WFD z band
Histogram of rotSkyPos for WFD z band.
rotSkyPos Histogram
OneDSlicer
WFD y band
Histogram of rotSkyPos for WFD y band.
|
Group: Rotskypos; Subgroup: WFD; Slicer: HealpixSubsetSlicer
|
| Metric Name |
Info Label |
Median |
Mean |
Rms |
N(-3Sigma) |
N(+3Sigma) |
Count |
Min |
Max |
| AngleMean rotSkyPos |
WFD all bands |
204.50
|
212.09
|
88.81
|
0
|
0
|
22469
|
0.0044
|
359.98
|
| AngleRange rotSkyPos |
WFD all bands |
296.90
|
294.73
|
39.04
|
0
|
0
|
22469
|
195.69
|
355.47
|
| AngleRms rotSkyPos |
WFD all bands |
65.06
|
65.77
|
10.61
|
0
|
72
|
22469
|
35.98
|
104.43
|
| AngleMean rotSkyPos |
WFD u band |
204.75
|
214.28
|
87.05
|
0
|
0
|
22469
|
0.0031
|
359.98
|
| AngleRange rotSkyPos |
WFD u band |
256.58
|
254.30
|
39.93
|
0
|
0
|
22469
|
134.89
|
338.72
|
| AngleRms rotSkyPos |
WFD u band |
63.28
|
64.57
|
11.75
|
0
|
107
|
22469
|
31.73
|
114.39
|
| AngleMean rotSkyPos |
WFD g band |
188.11
|
185.70
|
92.70
|
0
|
0
|
22469
|
0.04
|
359.98
|
| AngleRange rotSkyPos |
WFD g band |
276.05
|
266.94
|
41.66
|
0
|
0
|
22469
|
155.61
|
347.04
|
| AngleRms rotSkyPos |
WFD g band |
65.75
|
67.36
|
13.80
|
0
|
9
|
22469
|
33.29
|
118.31
|
| AngleMean rotSkyPos |
WFD r band |
194.80
|
206.02
|
90.73
|
0
|
0
|
22469
|
0.0005
|
359.99
|
| AngleRange rotSkyPos |
WFD r band |
288.17
|
280.98
|
38.95
|
0
|
0
|
22469
|
174.11
|
350.80
|
| AngleRms rotSkyPos |
WFD r band |
64.20
|
65.86
|
11.86
|
0
|
66
|
22469
|
35.16
|
108.06
|
| AngleMean rotSkyPos |
WFD i band |
207.19
|
212.55
|
88.46
|
0
|
0
|
22469
|
0.0035
|
360.00
|
| AngleRange rotSkyPos |
WFD i band |
285.59
|
281.30
|
39.69
|
0
|
0
|
22469
|
179.22
|
351.01
|
| AngleRms rotSkyPos |
WFD i band |
63.52
|
64.41
|
10.01
|
0
|
112
|
22469
|
35.75
|
108.54
|
| AngleMean rotSkyPos |
WFD z band |
208.71
|
211.78
|
88.08
|
0
|
0
|
22469
|
0.0047
|
360.00
|
| AngleRange rotSkyPos |
WFD z band |
285.75
|
281.81
|
38.98
|
0
|
0
|
22469
|
180.67
|
350.41
|
| AngleRms rotSkyPos |
WFD z band |
64.07
|
65.43
|
10.77
|
1
|
163
|
22469
|
31.58
|
115.89
|
| AngleMean rotSkyPos |
WFD y band |
225.36
|
229.96
|
78.80
|
0
|
0
|
22469
|
0.0009
|
360.00
|
| AngleRange rotSkyPos |
WFD y band |
276.01
|
273.37
|
36.34
|
0
|
0
|
22469
|
164.99
|
346.75
|
| AngleRms rotSkyPos |
WFD y band |
61.46
|
62.67
|
10.00
|
0
|
147
|
22469
|
40.17
|
115.82
|
|
Group: Rotskypos; Subgroup: WFD; Slicer: UniSlicer
|
| |
FullRangeAngle rotSkyPos |
Max rotSkyPos |
MeanAngle rotSkyPos |
Min rotSkyPos |
RmsAngle rotSkyPos |
| WFD all bands |
359.99
|
360.00
|
215.97
|
0.0004
|
88.33
|
| WFD g band |
359.96
|
360.00
|
190.98
|
0.0050
|
90.67
|
| WFD i band |
359.98
|
360.00
|
217.45
|
0.0015
|
87.38
|
| WFD r band |
359.99
|
360.00
|
207.73
|
0.0004
|
91.09
|
| WFD u band |
359.95
|
360.00
|
220.74
|
0.0083
|
88.49
|
| WFD y band |
359.98
|
360.00
|
228.35
|
0.0028
|
86.08
|
| WFD z band |
359.98
|
360.00
|
217.74
|
0.0038
|
88.75
|
Group: SRD FO metrics; Subgroup: All sky
fO
HealpixSlicer
All sky
The FO metric evaluates the overall efficiency of observing. foNv: out of 18000.00 sq degrees, the area receives at least X and a median of Y visits (out of 825, if compared to benchmark). fOArea: this many sq deg (out of 18000.00 sq deg if compared to benchmark) receives at least 825 visits.
|
Group: SRD FO metrics; Subgroup: All sky; Slicer: HealpixSlicer
|
|
|
|
|
| fOArea |
7309.41
|
| fOArea/benchmark |
0.41
|
| fOArea_750 |
18888.30
|
| fONv MedianNvis |
818.00
|
| fONv MinNvis |
768.00
|
| fONv/benchmark MedianNvis |
0.99
|
| fONv/benchmark MinNvis |
0.93
|
Group: SRD FO metrics; Subgroup: WFD
fO
HealpixSubsetSlicer
WFD
The FO metric evaluates the overall efficiency of observing. foNv: out of 18000.00 sq degrees, the area receives at least X and a median of Y visits (out of 825, if compared to benchmark). fOArea: this many sq deg (out of 18000.00 sq deg if compared to benchmark) receives at least 825 visits.
|
Group: SRD FO metrics; Subgroup: WFD; Slicer: HealpixSubsetSlicer
|
|
|
|
|
| fOArea |
7308.57
|
| fOArea/benchmark |
0.41
|
| fOArea_750 |
18858.09
|
| fONv MedianNvis |
818.00
|
| fONv MinNvis |
768.00
|
| fONv/benchmark MedianNvis |
0.99
|
| fONv/benchmark MinNvis |
0.93
|
Group: SRD Parallax; Subgroup: All sky
Normalized Parallax Uncert @ 21.3
HealpixSlicer
All sky y band only
Estimated uncertainty in parallax measurement (assuming no proper motion or that proper motion is well fit). Uses measurements in all bandpasses, and estimates astrometric error based on SNR in each visit. Assumes a flat SED. This normalized version of the metric displays the estimated uncertainty in the parallax measurement, divided by the minimum parallax uncertainty possible (if all visits were six months apart). Values closer to 1 indicate more optimal scheduling for parallax measurement.
Normalized Parallax Uncert @ 22.4
HealpixSlicer
All sky
Estimated uncertainty in parallax measurement (assuming no proper motion or that proper motion is well fit). Uses measurements in all bandpasses, and estimates astrometric error based on SNR in each visit. Assumes a flat SED. This normalized version of the metric displays the estimated uncertainty in the parallax measurement, divided by the minimum parallax uncertainty possible (if all visits were six months apart). Values closer to 1 indicate more optimal scheduling for parallax measurement.
Normalized Parallax Uncert @ 24.0
HealpixSlicer
All sky
Estimated uncertainty in parallax measurement (assuming no proper motion or that proper motion is well fit). Uses measurements in all bandpasses, and estimates astrometric error based on SNR in each visit. Assumes a flat SED. This normalized version of the metric displays the estimated uncertainty in the parallax measurement, divided by the minimum parallax uncertainty possible (if all visits were six months apart). Values closer to 1 indicate more optimal scheduling for parallax measurement.
Parallax Coverage @ 22.4
HealpixSlicer
All sky
Parallax factor coverage for an r=22.40 star (0 is bad, 0.5-1 is good). One expects the parallax factor coverage to vary because stars on the ecliptic can be observed when they have no parallax offset while stars at the pole are always offset by the full parallax offset.
Parallax Coverage @ 24.0
HealpixSlicer
All sky
Parallax factor coverage for an r=24.00 star (0 is bad, 0.5-1 is good). One expects the parallax factor coverage to vary because stars on the ecliptic can be observed when they have no parallax offset while stars at the pole are always offset by the full parallax offset.
Parallax Uncert @ 21.3
HealpixSlicer
All sky y band only
Estimated uncertainty in parallax measurement (assuming no proper motion or that proper motion is well fit). Uses measurements in all bandpasses, and estimates astrometric error based on SNR in each visit. Assumes a flat SED.
Parallax Uncert @ 22.4
HealpixSlicer
All sky
Estimated uncertainty in parallax measurement (assuming no proper motion or that proper motion is well fit). Uses measurements in all bandpasses, and estimates astrometric error based on SNR in each visit. Assumes a flat SED.
Parallax Uncert @ 24.0
HealpixSlicer
All sky
Estimated uncertainty in parallax measurement (assuming no proper motion or that proper motion is well fit). Uses measurements in all bandpasses, and estimates astrometric error based on SNR in each visit. Assumes a flat SED.
Parallax-DCR degeneracy @ 22.4
HealpixSlicer
All sky
Parallax-DCR degeneracy @ 22.4 calculated on a HealpixSlicer basis.
Parallax-DCR degeneracy @ 24.0
HealpixSlicer
All sky
Parallax-DCR degeneracy @ 24.0 calculated on a HealpixSlicer basis.
|
Group: SRD Parallax; Subgroup: All sky; Slicer: HealpixSlicer
|
| Metric Name |
Info Label |
Median |
Mean |
Rms |
N(-3Sigma) |
N(+3Sigma) |
Count |
Min |
Max |
95th Percentile Parallax Uncert |
Area better than 11.5 mas uncertainty |
Median Parallax Uncert (18k) |
| Parallax Uncert @ 22.4 |
All sky |
2.50
|
4.10
|
13.07
|
0
|
170
|
33578
|
0.34
|
883.31
|
9.35
|
27349.22
|
2.15
|
| Parallax Uncert @ 24.0 |
All sky |
10.04
|
16.96
|
56.95
|
0
|
170
|
33578
|
1.31
|
3855.35
|
39.71
|
17983.54
|
8.54
|
| Normalized Parallax Uncert @ 22.4 |
All sky |
0.72
|
0.74
|
0.12
|
18
|
0
|
33578
|
0.19
|
1.01
|
-- |
-- |
-- |
| Normalized Parallax Uncert @ 24.0 |
All sky |
0.72
|
0.74
|
0.12
|
17
|
0
|
33578
|
0.19
|
1.01
|
-- |
-- |
-- |
| Parallax Coverage @ 22.4 |
All sky |
0.55
|
0.56
|
0.07
|
166
|
132
|
33567
|
0.0000
|
0.95
|
-- |
-- |
-- |
| Parallax Coverage @ 24.0 |
All sky |
0.55
|
0.56
|
0.08
|
162
|
127
|
33567
|
0.0000
|
0.96
|
-- |
-- |
-- |
| Parallax-DCR degeneracy @ 22.4 |
All sky |
0.34
|
0.33
|
0.24
|
0
|
0
|
33578
|
-0.40
|
0.99
|
-- |
-- |
-- |
| Parallax-DCR degeneracy @ 24.0 |
All sky |
0.34
|
0.33
|
0.25
|
0
|
0
|
33578
|
-0.40
|
0.99
|
-- |
-- |
-- |
| Parallax Uncert @ 21.3 |
All sky y band only |
9.11
|
12.01
|
21.59
|
0
|
182
|
29952
|
1.39
|
2362.13
|
24.44
|
18814.45
|
8.20
|
| Normalized Parallax Uncert @ 21.3 |
All sky y band only |
0.75
|
0.77
|
0.11
|
26
|
0
|
29952
|
0.13
|
1.00
|
0.97
|
25138.52
|
0.71
|
Group: SRD Parallax; Subgroup: WFD
Normalized Parallax Uncert @ 21.3
HealpixSubsetSlicer
WFD y band only
Estimated uncertainty in parallax measurement (assuming no proper motion or that proper motion is well fit). Uses measurements in all bandpasses, and estimates astrometric error based on SNR in each visit. Assumes a flat SED. This normalized version of the metric displays the estimated uncertainty in the parallax measurement, divided by the minimum parallax uncertainty possible (if all visits were six months apart). Values closer to 1 indicate more optimal scheduling for parallax measurement.
Normalized Parallax Uncert @ 22.4
HealpixSubsetSlicer
WFD
Estimated uncertainty in parallax measurement (assuming no proper motion or that proper motion is well fit). Uses measurements in all bandpasses, and estimates astrometric error based on SNR in each visit. Assumes a flat SED. This normalized version of the metric displays the estimated uncertainty in the parallax measurement, divided by the minimum parallax uncertainty possible (if all visits were six months apart). Values closer to 1 indicate more optimal scheduling for parallax measurement.
Normalized Parallax Uncert @ 24.0
HealpixSubsetSlicer
WFD
Estimated uncertainty in parallax measurement (assuming no proper motion or that proper motion is well fit). Uses measurements in all bandpasses, and estimates astrometric error based on SNR in each visit. Assumes a flat SED. This normalized version of the metric displays the estimated uncertainty in the parallax measurement, divided by the minimum parallax uncertainty possible (if all visits were six months apart). Values closer to 1 indicate more optimal scheduling for parallax measurement.
Parallax Coverage @ 22.4
HealpixSubsetSlicer
WFD
Parallax factor coverage for an r=22.40 star (0 is bad, 0.5-1 is good). One expects the parallax factor coverage to vary because stars on the ecliptic can be observed when they have no parallax offset while stars at the pole are always offset by the full parallax offset.
Parallax Coverage @ 24.0
HealpixSubsetSlicer
WFD
Parallax factor coverage for an r=24.00 star (0 is bad, 0.5-1 is good). One expects the parallax factor coverage to vary because stars on the ecliptic can be observed when they have no parallax offset while stars at the pole are always offset by the full parallax offset.
Parallax Uncert @ 21.3
HealpixSubsetSlicer
WFD y band only
Estimated uncertainty in parallax measurement (assuming no proper motion or that proper motion is well fit). Uses measurements in all bandpasses, and estimates astrometric error based on SNR in each visit. Assumes a flat SED.
Parallax Uncert @ 22.4
HealpixSubsetSlicer
WFD
Estimated uncertainty in parallax measurement (assuming no proper motion or that proper motion is well fit). Uses measurements in all bandpasses, and estimates astrometric error based on SNR in each visit. Assumes a flat SED.
Parallax Uncert @ 24.0
HealpixSubsetSlicer
WFD
Estimated uncertainty in parallax measurement (assuming no proper motion or that proper motion is well fit). Uses measurements in all bandpasses, and estimates astrometric error based on SNR in each visit. Assumes a flat SED.
Parallax-DCR degeneracy @ 22.4
HealpixSubsetSlicer
WFD
Parallax-DCR degeneracy @ 22.4 calculated on a HealpixSubsetSlicer basis.
Parallax-DCR degeneracy @ 24.0
HealpixSubsetSlicer
WFD
Parallax-DCR degeneracy @ 24.0 calculated on a HealpixSubsetSlicer basis.
|
Group: SRD Parallax; Subgroup: WFD; Slicer: HealpixSubsetSlicer
|
| Metric Name |
Info Label |
Median |
Mean |
Rms |
N(-3Sigma) |
N(+3Sigma) |
Count |
Min |
Max |
95th Percentile Parallax Uncert |
Area better than 11.5 mas uncertainty |
Median Parallax Uncert (18k) |
| Parallax Uncert @ 22.4 |
WFD |
2.22
|
2.26
|
0.52
|
77
|
91
|
22469
|
0.34
|
4.33
|
3.18
|
18858.09
|
2.18
|
| Parallax Uncert @ 24.0 |
WFD |
8.83
|
9.07
|
2.25
|
62
|
124
|
22469
|
1.31
|
18.39
|
13.18
|
16240.33
|
8.69
|
| Normalized Parallax Uncert @ 22.4 |
WFD |
0.73
|
0.75
|
0.11
|
0
|
0
|
22469
|
0.49
|
0.99
|
-- |
-- |
-- |
| Normalized Parallax Uncert @ 24.0 |
WFD |
0.73
|
0.75
|
0.11
|
0
|
0
|
22469
|
0.50
|
0.99
|
-- |
-- |
-- |
| Parallax Coverage @ 22.4 |
WFD |
0.56
|
0.57
|
0.06
|
35
|
115
|
22469
|
0.35
|
0.79
|
-- |
-- |
-- |
| Parallax Coverage @ 24.0 |
WFD |
0.56
|
0.57
|
0.06
|
21
|
119
|
22469
|
0.34
|
0.79
|
-- |
-- |
-- |
| Parallax-DCR degeneracy @ 22.4 |
WFD |
0.34
|
0.33
|
0.25
|
0
|
0
|
22469
|
-0.26
|
0.78
|
-- |
-- |
-- |
| Parallax-DCR degeneracy @ 24.0 |
WFD |
0.34
|
0.33
|
0.25
|
0
|
0
|
22469
|
-0.28
|
0.79
|
-- |
-- |
-- |
| Parallax Uncert @ 21.3 |
WFD y band only |
8.38
|
8.54
|
1.98
|
67
|
128
|
22469
|
1.39
|
18.07
|
11.96
|
17469.06
|
8.26
|
| Normalized Parallax Uncert @ 21.3 |
WFD y band only |
0.74
|
0.76
|
0.10
|
0
|
0
|
22469
|
0.51
|
0.99
|
0.96
|
18858.09
|
0.74
|
Group: SRD Proper Motion; Subgroup: All sky
Normalized Proper Motion Uncert @ 20.5
HealpixSlicer
All sky
Estimated uncertainty of the proper motion fit (assuming no parallax or that parallax is well fit). Uses visits in all bands, and generates approximate astrometric errors using the SNR in each visit. Assumes a flat SED. This normalized version of the metric represents the estimated uncertainty in the proper motion divided by the minimum uncertainty possible (if all visits were obtained on the first and last days of the survey). Values closer to 1 indicate more optimal scheduling.
Normalized Proper Motion Uncert @ 24.0
HealpixSlicer
All sky
Estimated uncertainty of the proper motion fit (assuming no parallax or that parallax is well fit). Uses visits in all bands, and generates approximate astrometric errors using the SNR in each visit. Assumes a flat SED. This normalized version of the metric represents the estimated uncertainty in the proper motion divided by the minimum uncertainty possible (if all visits were obtained on the first and last days of the survey). Values closer to 1 indicate more optimal scheduling.
Proper Motion Uncert @ 20.5
HealpixSlicer
All sky
Estimated uncertainty of the proper motion fit (assuming no parallax or that parallax is well fit). Uses visits in all bands, and generates approximate astrometric errors using the SNR in each visit. Assumes a flat SED.
Proper Motion Uncert @ 24.0
HealpixSlicer
All sky
Estimated uncertainty of the proper motion fit (assuming no parallax or that parallax is well fit). Uses visits in all bands, and generates approximate astrometric errors using the SNR in each visit. Assumes a flat SED.
|
Group: SRD Proper Motion; Subgroup: All sky; Slicer: HealpixSlicer
|
|
|
|
|
|
|
|
|
|
|
| Median |
0.20
|
2.39
|
0.60
|
0.62
|
| Mean |
0.46
|
8.18
|
0.60
|
0.61
|
| Rms |
20.29
|
468.24
|
0.04
|
0.05
|
| N(-3Sigma) |
0
|
0
|
136
|
147
|
| N(+3Sigma) |
7
|
7
|
265
|
194
|
| Count |
33517
|
33517
|
33517
|
33517
|
| Min |
0.0297
|
0.38
|
0.0014
|
0.0014
|
| Max |
2603.26
|
60045.02
|
1.19
|
1.43
|
| 95th Percentile Proper Motion Uncert |
0.42
|
6.37
|
-- |
-- |
| Median Proper Motion Uncert (18k) |
0.18
|
2.09
|
-- |
-- |
Group: SRD Proper Motion; Subgroup: WFD
Normalized Proper Motion Uncert @ 20.5
HealpixSubsetSlicer
WFD
Estimated uncertainty of the proper motion fit (assuming no parallax or that parallax is well fit). Uses visits in all bands, and generates approximate astrometric errors using the SNR in each visit. Assumes a flat SED. This normalized version of the metric represents the estimated uncertainty in the proper motion divided by the minimum uncertainty possible (if all visits were obtained on the first and last days of the survey). Values closer to 1 indicate more optimal scheduling.
Normalized Proper Motion Uncert @ 24.0
HealpixSubsetSlicer
WFD
Estimated uncertainty of the proper motion fit (assuming no parallax or that parallax is well fit). Uses visits in all bands, and generates approximate astrometric errors using the SNR in each visit. Assumes a flat SED. This normalized version of the metric represents the estimated uncertainty in the proper motion divided by the minimum uncertainty possible (if all visits were obtained on the first and last days of the survey). Values closer to 1 indicate more optimal scheduling.
Proper Motion Uncert @ 20.5
HealpixSubsetSlicer
WFD
Estimated uncertainty of the proper motion fit (assuming no parallax or that parallax is well fit). Uses visits in all bands, and generates approximate astrometric errors using the SNR in each visit. Assumes a flat SED.
Proper Motion Uncert @ 24.0
HealpixSubsetSlicer
WFD
Estimated uncertainty of the proper motion fit (assuming no parallax or that parallax is well fit). Uses visits in all bands, and generates approximate astrometric errors using the SNR in each visit. Assumes a flat SED.
|
Group: SRD Proper Motion; Subgroup: WFD; Slicer: HealpixSubsetSlicer
|
|
|
|
|
|
|
|
|
|
|
| Median |
0.19
|
2.13
|
0.60
|
0.61
|
| Mean |
0.19
|
2.21
|
0.59
|
0.60
|
| Rms |
0.0185
|
0.43
|
0.0269
|
0.04
|
| N(-3Sigma) |
116
|
96
|
2
|
9
|
| N(+3Sigma) |
29
|
173
|
1
|
0
|
| Count |
22469
|
22469
|
22469
|
22469
|
| Min |
0.0297
|
0.38
|
0.50
|
0.47
|
| Max |
0.25
|
4.26
|
0.68
|
0.73
|
| 95th Percentile Proper Motion Uncert |
0.21
|
2.81
|
-- |
-- |
| Median Proper Motion Uncert (18k) |
0.18
|
2.11
|
-- |
-- |
Group: SRD Rapid Revisits; Subgroup: All sky
NumberOfQuickRevisits
HealpixSlicer
All sky
Number of consecutive visits with return times faster than 30.0 minutes, in any filter, all proposals.
RapidRevisits
HealpixSlicer
All sky
Rapid Revisit: area that receives at least 82 visits between 0.667 and 30.0 minutes, with at least 28 of those visits falling between 0.667 and 20.0 minutes. Summary statistic "Area" indicates the area on the sky which meets this requirement. (SRD design specification is 2000 sq deg).
|
Group: SRD Rapid Revisits; Subgroup: All sky; Slicer: HealpixSlicer
|
|
|
|
|
|
|
| Median |
160.00
|
-- |
| Mean |
178.05
|
-- |
| Rms |
857.94
|
-- |
| N(-3Sigma) |
0
|
-- |
| N(+3Sigma) |
104
|
-- |
| Min |
0.0000
|
-- |
| Max |
35852.00
|
-- |
| Area (sq deg) |
-- |
29399.71
|
Group: SRD Rapid Revisits; Subgroup: WFD
NumberOfQuickRevisits
HealpixSubsetSlicer
WFD
Number of consecutive visits with return times faster than 30.0 minutes, in any filter, all proposals.
RapidRevisits
HealpixSubsetSlicer
WFD
Rapid Revisit: area that receives at least 82 visits between 0.667 and 30.0 minutes, with at least 28 of those visits falling between 0.667 and 20.0 minutes. Summary statistic "Area" indicates the area on the sky which meets this requirement. (SRD design specification is 2000 sq deg).
|
Group: SRD Rapid Revisits; Subgroup: WFD; Slicer: HealpixSubsetSlicer
|
|
|
|
|
|
|
| Median |
179.00
|
-- |
| Mean |
240.39
|
-- |
| Rms |
1040.85
|
-- |
| N(-3Sigma) |
0
|
-- |
| N(+3Sigma) |
95
|
-- |
| Min |
73.00
|
-- |
| Max |
35852.00
|
-- |
| Area (sq deg) |
-- |
41229.09
|
Group: Saturation_mag; Subgroup: All sky
Max saturation_mag
HealpixSlicer
All sky all bands
Map of Max saturation_mag for All sky all bands.
Max saturation_mag
HealpixSlicer
All sky u band
Map of Max saturation_mag for All sky u band.
Max saturation_mag
HealpixSlicer
All sky g band
Map of Max saturation_mag for All sky g band.
Max saturation_mag
HealpixSlicer
All sky r band
Map of Max saturation_mag for All sky r band.
Max saturation_mag
HealpixSlicer
All sky i band
Map of Max saturation_mag for All sky i band.
Max saturation_mag
HealpixSlicer
All sky z band
Map of Max saturation_mag for All sky z band.
Max saturation_mag
HealpixSlicer
All sky y band
Map of Max saturation_mag for All sky y band.
Median saturation_mag
HealpixSlicer
All sky all bands
Map of Median saturation_mag for All sky all bands.
Median saturation_mag
HealpixSlicer
All sky u band
Map of Median saturation_mag for All sky u band.
Median saturation_mag
HealpixSlicer
All sky g band
Map of Median saturation_mag for All sky g band.
Median saturation_mag
HealpixSlicer
All sky r band
Map of Median saturation_mag for All sky r band.
Median saturation_mag
HealpixSlicer
All sky i band
Map of Median saturation_mag for All sky i band.
Median saturation_mag
HealpixSlicer
All sky z band
Map of Median saturation_mag for All sky z band.
Median saturation_mag
HealpixSlicer
All sky y band
Map of Median saturation_mag for All sky y band.
Min saturation_mag
HealpixSlicer
All sky all bands
Map of Min saturation_mag for All sky all bands.
Min saturation_mag
HealpixSlicer
All sky u band
Map of Min saturation_mag for All sky u band.
Min saturation_mag
HealpixSlicer
All sky g band
Map of Min saturation_mag for All sky g band.
Min saturation_mag
HealpixSlicer
All sky r band
Map of Min saturation_mag for All sky r band.
Min saturation_mag
HealpixSlicer
All sky i band
Map of Min saturation_mag for All sky i band.
Min saturation_mag
HealpixSlicer
All sky z band
Map of Min saturation_mag for All sky z band.
Min saturation_mag
HealpixSlicer
All sky y band
Map of Min saturation_mag for All sky y band.
saturation_mag Histogram
OneDSlicer
All sky all bands
Histogram of saturation_mag for All sky all bands.
saturation_mag Histogram
OneDSlicer
All sky u band
Histogram of saturation_mag for All sky u band.
saturation_mag Histogram
OneDSlicer
All sky g band
Histogram of saturation_mag for All sky g band.
saturation_mag Histogram
OneDSlicer
All sky r band
Histogram of saturation_mag for All sky r band.
saturation_mag Histogram
OneDSlicer
All sky i band
Histogram of saturation_mag for All sky i band.
saturation_mag Histogram
OneDSlicer
All sky z band
Histogram of saturation_mag for All sky z band.
saturation_mag Histogram
OneDSlicer
All sky y band
Histogram of saturation_mag for All sky y band.
|
Group: Saturation_mag; Subgroup: All sky; Slicer: HealpixSlicer
|
| Metric Name |
Info Label |
Median |
Mean |
Rms |
N(-3Sigma) |
N(+3Sigma) |
Count |
Min |
Max |
| Max saturation_mag |
All sky all bands |
15.76
|
15.70
|
0.32
|
789
|
0
|
33578
|
11.80
|
16.37
|
| Median saturation_mag |
All sky all bands |
14.12
|
14.11
|
0.22
|
193
|
2
|
33578
|
11.80
|
14.93
|
| Min saturation_mag |
All sky all bands |
11.23
|
11.24
|
0.59
|
70
|
108
|
33578
|
9.23
|
14.75
|
| Max saturation_mag |
All sky u band |
14.03
|
13.98
|
0.36
|
474
|
0
|
29864
|
10.44
|
15.04
|
| Median saturation_mag |
All sky u band |
12.98
|
12.96
|
0.28
|
330
|
81
|
29864
|
10.44
|
14.13
|
| Min saturation_mag |
All sky u band |
11.51
|
11.50
|
0.52
|
267
|
63
|
29864
|
9.23
|
14.13
|
| Max saturation_mag |
All sky g band |
15.66
|
15.59
|
0.37
|
796
|
0
|
33481
|
12.62
|
16.37
|
| Median saturation_mag |
All sky g band |
14.54
|
14.49
|
0.33
|
256
|
0
|
33481
|
12.29
|
15.36
|
| Min saturation_mag |
All sky g band |
12.79
|
12.75
|
0.50
|
167
|
29
|
33481
|
10.64
|
15.06
|
| Max saturation_mag |
All sky r band |
15.70
|
15.63
|
0.33
|
809
|
0
|
33540
|
12.75
|
16.25
|
| Median saturation_mag |
All sky r band |
14.56
|
14.53
|
0.30
|
328
|
0
|
33540
|
12.75
|
15.20
|
| Min saturation_mag |
All sky r band |
12.57
|
12.55
|
0.46
|
195
|
106
|
33540
|
10.57
|
15.20
|
| Max saturation_mag |
All sky i band |
15.55
|
15.49
|
0.31
|
684
|
0
|
33538
|
11.80
|
16.13
|
| Median saturation_mag |
All sky i band |
14.48
|
14.44
|
0.28
|
260
|
0
|
33538
|
11.80
|
15.11
|
| Min saturation_mag |
All sky i band |
12.49
|
12.46
|
0.50
|
409
|
56
|
33538
|
10.13
|
15.11
|
| Max saturation_mag |
All sky z band |
15.15
|
15.08
|
0.31
|
530
|
0
|
33510
|
12.50
|
15.73
|
| Median saturation_mag |
All sky z band |
14.07
|
14.04
|
0.25
|
327
|
0
|
33510
|
12.37
|
14.75
|
| Min saturation_mag |
All sky z band |
12.20
|
12.15
|
0.56
|
257
|
31
|
33510
|
9.95
|
14.75
|
| Max saturation_mag |
All sky y band |
14.14
|
14.10
|
0.25
|
555
|
0
|
29952
|
11.36
|
14.70
|
| Median saturation_mag |
All sky y band |
13.13
|
13.11
|
0.19
|
280
|
3
|
29952
|
11.36
|
13.75
|
| Min saturation_mag |
All sky y band |
11.38
|
11.34
|
0.53
|
292
|
47
|
29952
|
9.42
|
13.71
|
|
Group: Saturation_mag; Subgroup: All sky; Slicer: UniSlicer
|
| |
25th%ile saturation_mag |
75th%ile saturation_mag |
Count saturation_mag |
Max saturation_mag |
Mean saturation_mag |
Median saturation_mag |
Min saturation_mag |
N(+3Sigma) saturation_mag |
N(-3Sigma) saturation_mag |
Rms saturation_mag |
| All sky all bands |
13.44
|
14.71
|
2147095
|
16.37
|
14.04
|
14.14
|
9.23
|
0
|
6676
|
0.87
|
| All sky g band |
14.05
|
15.00
|
196987
|
16.37
|
14.48
|
14.53
|
10.64
|
0
|
1073
|
0.69
|
| All sky i band |
14.03
|
14.91
|
500895
|
16.13
|
14.42
|
14.51
|
10.13
|
0
|
3496
|
0.64
|
| All sky r band |
14.10
|
15.02
|
489465
|
16.25
|
14.52
|
14.59
|
10.57
|
0
|
2977
|
0.66
|
| All sky u band |
12.54
|
13.37
|
124477
|
15.04
|
12.93
|
12.98
|
9.23
|
15
|
617
|
0.63
|
| All sky y band |
12.73
|
13.48
|
394073
|
14.70
|
13.07
|
13.13
|
9.42
|
0
|
2840
|
0.57
|
| All sky z band |
13.68
|
14.49
|
441198
|
15.73
|
14.05
|
14.12
|
9.95
|
0
|
3256
|
0.62
|
Group: Saturation_mag; Subgroup: WFD
Max saturation_mag
HealpixSubsetSlicer
WFD all bands
Map of Max saturation_mag for WFD all bands.
Max saturation_mag
HealpixSubsetSlicer
WFD u band
Map of Max saturation_mag for WFD u band.
Max saturation_mag
HealpixSubsetSlicer
WFD g band
Map of Max saturation_mag for WFD g band.
Max saturation_mag
HealpixSubsetSlicer
WFD r band
Map of Max saturation_mag for WFD r band.
Max saturation_mag
HealpixSubsetSlicer
WFD i band
Map of Max saturation_mag for WFD i band.
Max saturation_mag
HealpixSubsetSlicer
WFD z band
Map of Max saturation_mag for WFD z band.
Max saturation_mag
HealpixSubsetSlicer
WFD y band
Map of Max saturation_mag for WFD y band.
Median saturation_mag
HealpixSubsetSlicer
WFD all bands
Map of Median saturation_mag for WFD all bands.
Median saturation_mag
HealpixSubsetSlicer
WFD u band
Map of Median saturation_mag for WFD u band.
Median saturation_mag
HealpixSubsetSlicer
WFD g band
Map of Median saturation_mag for WFD g band.
Median saturation_mag
HealpixSubsetSlicer
WFD r band
Map of Median saturation_mag for WFD r band.
Median saturation_mag
HealpixSubsetSlicer
WFD i band
Map of Median saturation_mag for WFD i band.
Median saturation_mag
HealpixSubsetSlicer
WFD z band
Map of Median saturation_mag for WFD z band.
Median saturation_mag
HealpixSubsetSlicer
WFD y band
Map of Median saturation_mag for WFD y band.
Min saturation_mag
HealpixSubsetSlicer
WFD all bands
Map of Min saturation_mag for WFD all bands.
Min saturation_mag
HealpixSubsetSlicer
WFD u band
Map of Min saturation_mag for WFD u band.
Min saturation_mag
HealpixSubsetSlicer
WFD g band
Map of Min saturation_mag for WFD g band.
Min saturation_mag
HealpixSubsetSlicer
WFD r band
Map of Min saturation_mag for WFD r band.
Min saturation_mag
HealpixSubsetSlicer
WFD i band
Map of Min saturation_mag for WFD i band.
Min saturation_mag
HealpixSubsetSlicer
WFD z band
Map of Min saturation_mag for WFD z band.
Min saturation_mag
HealpixSubsetSlicer
WFD y band
Map of Min saturation_mag for WFD y band.
saturation_mag Histogram
OneDSlicer
WFD all bands
Histogram of saturation_mag for WFD all bands.
saturation_mag Histogram
OneDSlicer
WFD u band
Histogram of saturation_mag for WFD u band.
saturation_mag Histogram
OneDSlicer
WFD g band
Histogram of saturation_mag for WFD g band.
saturation_mag Histogram
OneDSlicer
WFD r band
Histogram of saturation_mag for WFD r band.
saturation_mag Histogram
OneDSlicer
WFD i band
Histogram of saturation_mag for WFD i band.
saturation_mag Histogram
OneDSlicer
WFD z band
Histogram of saturation_mag for WFD z band.
saturation_mag Histogram
OneDSlicer
WFD y band
Histogram of saturation_mag for WFD y band.
|
Group: Saturation_mag; Subgroup: WFD; Slicer: HealpixSubsetSlicer
|
| Metric Name |
Info Label |
Median |
Mean |
Rms |
N(-3Sigma) |
N(+3Sigma) |
Count |
Min |
Max |
| Max saturation_mag |
WFD all bands |
15.81
|
15.82
|
0.16
|
70
|
22
|
22469
|
15.16
|
16.37
|
| Median saturation_mag |
WFD all bands |
14.15
|
14.15
|
0.18
|
36
|
0
|
22469
|
13.56
|
14.57
|
| Min saturation_mag |
WFD all bands |
11.09
|
11.05
|
0.46
|
273
|
0
|
22469
|
9.23
|
12.39
|
| Max saturation_mag |
WFD u band |
14.06
|
14.06
|
0.26
|
29
|
142
|
22469
|
13.04
|
15.04
|
| Median saturation_mag |
WFD u band |
13.00
|
12.99
|
0.21
|
110
|
6
|
22469
|
12.15
|
13.65
|
| Min saturation_mag |
WFD u band |
11.45
|
11.41
|
0.44
|
240
|
0
|
22469
|
9.23
|
12.66
|
| Max saturation_mag |
WFD g band |
15.72
|
15.72
|
0.19
|
109
|
22
|
22469
|
14.79
|
16.37
|
| Median saturation_mag |
WFD g band |
14.59
|
14.58
|
0.22
|
32
|
0
|
22469
|
13.84
|
15.13
|
| Min saturation_mag |
WFD g band |
12.77
|
12.72
|
0.46
|
190
|
0
|
22469
|
10.64
|
13.97
|
| Max saturation_mag |
WFD r band |
15.75
|
15.75
|
0.16
|
99
|
0
|
22469
|
15.10
|
16.19
|
| Median saturation_mag |
WFD r band |
14.61
|
14.62
|
0.20
|
54
|
0
|
22469
|
13.86
|
15.05
|
| Min saturation_mag |
WFD r band |
12.53
|
12.48
|
0.43
|
180
|
0
|
22469
|
10.57
|
13.77
|
| Max saturation_mag |
WFD i band |
15.61
|
15.61
|
0.16
|
55
|
46
|
22469
|
14.99
|
16.13
|
| Median saturation_mag |
WFD i band |
14.54
|
14.54
|
0.19
|
15
|
0
|
22469
|
13.95
|
14.98
|
| Min saturation_mag |
WFD i band |
12.44
|
12.38
|
0.49
|
274
|
0
|
22469
|
10.13
|
13.65
|
| Max saturation_mag |
WFD z band |
15.22
|
15.21
|
0.16
|
13
|
21
|
22469
|
14.64
|
15.73
|
| Median saturation_mag |
WFD z band |
14.13
|
14.13
|
0.16
|
28
|
0
|
22469
|
13.58
|
14.55
|
| Min saturation_mag |
WFD z band |
12.13
|
12.05
|
0.53
|
148
|
0
|
22469
|
9.95
|
13.21
|
| Max saturation_mag |
WFD y band |
14.18
|
14.17
|
0.16
|
96
|
53
|
22469
|
13.48
|
14.70
|
| Median saturation_mag |
WFD y band |
13.14
|
13.13
|
0.16
|
43
|
0
|
22469
|
12.59
|
13.53
|
| Min saturation_mag |
WFD y band |
11.29
|
11.22
|
0.48
|
283
|
0
|
22469
|
9.42
|
12.39
|
|
Group: Saturation_mag; Subgroup: WFD; Slicer: UniSlicer
|
| |
25th%ile saturation_mag |
75th%ile saturation_mag |
Count saturation_mag |
Max saturation_mag |
Mean saturation_mag |
Median saturation_mag |
Min saturation_mag |
N(+3Sigma) saturation_mag |
N(-3Sigma) saturation_mag |
Rms saturation_mag |
| WFD all bands |
13.44
|
14.71
|
2147095
|
16.37
|
14.04
|
14.14
|
9.23
|
0
|
6676
|
0.87
|
| WFD g band |
14.05
|
15.00
|
196987
|
16.37
|
14.48
|
14.53
|
10.64
|
0
|
1073
|
0.69
|
| WFD i band |
14.03
|
14.91
|
500895
|
16.13
|
14.42
|
14.51
|
10.13
|
0
|
3496
|
0.64
|
| WFD r band |
14.10
|
15.02
|
489465
|
16.25
|
14.52
|
14.59
|
10.57
|
0
|
2977
|
0.66
|
| WFD u band |
12.54
|
13.37
|
124477
|
15.04
|
12.93
|
12.98
|
9.23
|
15
|
617
|
0.63
|
| WFD y band |
12.73
|
13.48
|
394073
|
14.70
|
13.07
|
13.13
|
9.42
|
0
|
2840
|
0.57
|
| WFD z band |
13.68
|
14.49
|
441198
|
15.73
|
14.05
|
14.12
|
9.95
|
0
|
3256
|
0.62
|
Group: Seeingeff; Subgroup: All sky
Max seeingEff
HealpixSlicer
All sky all bands
Map of Max seeingEff (seeingFwhmEff) for All sky all bands.
Max seeingEff
HealpixSlicer
All sky u band
Map of Max seeingEff (seeingFwhmEff) for All sky u band.
Max seeingEff
HealpixSlicer
All sky g band
Map of Max seeingEff (seeingFwhmEff) for All sky g band.
Max seeingEff
HealpixSlicer
All sky r band
Map of Max seeingEff (seeingFwhmEff) for All sky r band.
Max seeingEff
HealpixSlicer
All sky i band
Map of Max seeingEff (seeingFwhmEff) for All sky i band.
Max seeingEff
HealpixSlicer
All sky z band
Map of Max seeingEff (seeingFwhmEff) for All sky z band.
Max seeingEff
HealpixSlicer
All sky y band
Map of Max seeingEff (seeingFwhmEff) for All sky y band.
Median seeingEff
HealpixSlicer
All sky all bands
Map of Median seeingEff (seeingFwhmEff) for All sky all bands.
Median seeingEff
HealpixSlicer
All sky u band
Map of Median seeingEff (seeingFwhmEff) for All sky u band.
Median seeingEff
HealpixSlicer
All sky g band
Map of Median seeingEff (seeingFwhmEff) for All sky g band.
Median seeingEff
HealpixSlicer
All sky r band
Map of Median seeingEff (seeingFwhmEff) for All sky r band.
Median seeingEff
HealpixSlicer
All sky i band
Map of Median seeingEff (seeingFwhmEff) for All sky i band.
Median seeingEff
HealpixSlicer
All sky z band
Map of Median seeingEff (seeingFwhmEff) for All sky z band.
Median seeingEff
HealpixSlicer
All sky y band
Map of Median seeingEff (seeingFwhmEff) for All sky y band.
Min seeingEff
HealpixSlicer
All sky all bands
Map of Min seeingEff (seeingFwhmEff) for All sky all bands.
Min seeingEff
HealpixSlicer
All sky u band
Map of Min seeingEff (seeingFwhmEff) for All sky u band.
Min seeingEff
HealpixSlicer
All sky g band
Map of Min seeingEff (seeingFwhmEff) for All sky g band.
Min seeingEff
HealpixSlicer
All sky r band
Map of Min seeingEff (seeingFwhmEff) for All sky r band.
Min seeingEff
HealpixSlicer
All sky i band
Map of Min seeingEff (seeingFwhmEff) for All sky i band.
Min seeingEff
HealpixSlicer
All sky z band
Map of Min seeingEff (seeingFwhmEff) for All sky z band.
Min seeingEff
HealpixSlicer
All sky y band
Map of Min seeingEff (seeingFwhmEff) for All sky y band.
seeingEff Histogram
OneDSlicer
All sky all bands
Histogram of seeingFwhmEff (seeingEff) for All sky all bands.
seeingEff Histogram
OneDSlicer
All sky u band
Histogram of seeingFwhmEff (seeingEff) for All sky u band.
seeingEff Histogram
OneDSlicer
All sky g band
Histogram of seeingFwhmEff (seeingEff) for All sky g band.
seeingEff Histogram
OneDSlicer
All sky r band
Histogram of seeingFwhmEff (seeingEff) for All sky r band.
seeingEff Histogram
OneDSlicer
All sky i band
Histogram of seeingFwhmEff (seeingEff) for All sky i band.
seeingEff Histogram
OneDSlicer
All sky z band
Histogram of seeingFwhmEff (seeingEff) for All sky z band.
seeingEff Histogram
OneDSlicer
All sky y band
Histogram of seeingFwhmEff (seeingEff) for All sky y band.
|
Group: Seeingeff; Subgroup: All sky; Slicer: HealpixSlicer
|
| Metric Name |
Info Label |
Median |
Mean |
Rms |
N(-3Sigma) |
N(+3Sigma) |
Count |
Min |
Max |
| Max seeingEff |
All sky all bands |
3.12
|
3.28
|
0.78
|
1
|
481
|
33578
|
0.76
|
7.08
|
| Median seeingEff |
All sky all bands |
1.05
|
1.07
|
0.13
|
0
|
472
|
33578
|
0.76
|
3.47
|
| Min seeingEff |
All sky all bands |
0.59
|
0.61
|
0.09
|
0
|
663
|
33578
|
0.48
|
3.47
|
| Max seeingEff |
All sky u band |
2.35
|
2.43
|
0.60
|
0
|
315
|
29864
|
0.74
|
6.53
|
| Median seeingEff |
All sky u band |
1.24
|
1.25
|
0.14
|
37
|
314
|
29864
|
0.74
|
3.42
|
| Min seeingEff |
All sky u band |
0.78
|
0.80
|
0.13
|
0
|
496
|
29864
|
0.50
|
3.42
|
| Max seeingEff |
All sky g band |
2.44
|
2.55
|
0.61
|
0
|
338
|
33481
|
0.88
|
6.04
|
| Median seeingEff |
All sky g band |
1.12
|
1.15
|
0.16
|
0
|
360
|
33481
|
0.78
|
2.98
|
| Min seeingEff |
All sky g band |
0.68
|
0.70
|
0.13
|
0
|
775
|
33481
|
0.49
|
2.54
|
| Max seeingEff |
All sky r band |
2.58
|
2.68
|
0.60
|
2
|
497
|
33540
|
0.77
|
6.57
|
| Median seeingEff |
All sky r band |
1.06
|
1.08
|
0.14
|
0
|
460
|
33540
|
0.77
|
2.34
|
| Min seeingEff |
All sky r band |
0.63
|
0.65
|
0.11
|
0
|
820
|
33540
|
0.49
|
2.34
|
| Max seeingEff |
All sky i band |
2.49
|
2.60
|
0.65
|
0
|
660
|
33538
|
0.76
|
7.08
|
| Median seeingEff |
All sky i band |
1.01
|
1.04
|
0.13
|
0
|
382
|
33538
|
0.76
|
3.47
|
| Min seeingEff |
All sky i band |
0.62
|
0.65
|
0.10
|
0
|
699
|
33538
|
0.48
|
3.47
|
| Max seeingEff |
All sky z band |
2.41
|
2.56
|
0.73
|
0
|
681
|
33510
|
0.75
|
6.64
|
| Median seeingEff |
All sky z band |
1.03
|
1.05
|
0.12
|
0
|
436
|
33510
|
0.75
|
2.27
|
| Min seeingEff |
All sky z band |
0.63
|
0.66
|
0.10
|
0
|
572
|
33510
|
0.48
|
2.06
|
| Max seeingEff |
All sky y band |
2.20
|
2.31
|
0.61
|
0
|
571
|
29952
|
0.75
|
5.45
|
| Median seeingEff |
All sky y band |
1.00
|
1.01
|
0.08
|
3
|
295
|
29952
|
0.75
|
2.07
|
| Min seeingEff |
All sky y band |
0.63
|
0.65
|
0.08
|
0
|
562
|
29952
|
0.49
|
2.07
|
|
Group: Seeingeff; Subgroup: All sky; Slicer: UniSlicer
|
| |
25th%ile seeingEff |
75th%ile seeingEff |
Count seeingEff |
Max seeingEff |
Mean seeingEff |
Median seeingEff |
Min seeingEff |
N(+3Sigma) seeingEff |
N(-3Sigma) seeingEff |
Rms seeingEff |
| All sky all bands |
0.86
|
1.27
|
2147095
|
7.08
|
1.11
|
1.03
|
0.48
|
32973
|
0
|
0.36
|
| All sky g band |
0.91
|
1.39
|
196987
|
6.04
|
1.20
|
1.12
|
0.49
|
3044
|
0
|
0.41
|
| All sky i band |
0.84
|
1.24
|
500895
|
7.08
|
1.09
|
1.00
|
0.48
|
7967
|
0
|
0.36
|
| All sky r band |
0.86
|
1.29
|
489465
|
6.57
|
1.12
|
1.04
|
0.49
|
7351
|
0
|
0.37
|
| All sky u band |
1.04
|
1.49
|
124477
|
6.53
|
1.31
|
1.24
|
0.50
|
1699
|
0
|
0.39
|
| All sky y band |
0.86
|
1.20
|
394073
|
5.45
|
1.06
|
1.00
|
0.49
|
5692
|
0
|
0.31
|
| All sky z band |
0.85
|
1.23
|
441198
|
6.64
|
1.09
|
1.01
|
0.48
|
6728
|
0
|
0.35
|
Group: Seeingeff; Subgroup: WFD
Max seeingEff
HealpixSubsetSlicer
WFD all bands
Map of Max seeingEff (seeingFwhmEff) for WFD all bands.
Max seeingEff
HealpixSubsetSlicer
WFD u band
Map of Max seeingEff (seeingFwhmEff) for WFD u band.
Max seeingEff
HealpixSubsetSlicer
WFD g band
Map of Max seeingEff (seeingFwhmEff) for WFD g band.
Max seeingEff
HealpixSubsetSlicer
WFD r band
Map of Max seeingEff (seeingFwhmEff) for WFD r band.
Max seeingEff
HealpixSubsetSlicer
WFD i band
Map of Max seeingEff (seeingFwhmEff) for WFD i band.
Max seeingEff
HealpixSubsetSlicer
WFD z band
Map of Max seeingEff (seeingFwhmEff) for WFD z band.
Max seeingEff
HealpixSubsetSlicer
WFD y band
Map of Max seeingEff (seeingFwhmEff) for WFD y band.
Median seeingEff
HealpixSubsetSlicer
WFD all bands
Map of Median seeingEff (seeingFwhmEff) for WFD all bands.
Median seeingEff
HealpixSubsetSlicer
WFD u band
Map of Median seeingEff (seeingFwhmEff) for WFD u band.
Median seeingEff
HealpixSubsetSlicer
WFD g band
Map of Median seeingEff (seeingFwhmEff) for WFD g band.
Median seeingEff
HealpixSubsetSlicer
WFD r band
Map of Median seeingEff (seeingFwhmEff) for WFD r band.
Median seeingEff
HealpixSubsetSlicer
WFD i band
Map of Median seeingEff (seeingFwhmEff) for WFD i band.
Median seeingEff
HealpixSubsetSlicer
WFD z band
Map of Median seeingEff (seeingFwhmEff) for WFD z band.
Median seeingEff
HealpixSubsetSlicer
WFD y band
Map of Median seeingEff (seeingFwhmEff) for WFD y band.
Min seeingEff
HealpixSubsetSlicer
WFD all bands
Map of Min seeingEff (seeingFwhmEff) for WFD all bands.
Min seeingEff
HealpixSubsetSlicer
WFD u band
Map of Min seeingEff (seeingFwhmEff) for WFD u band.
Min seeingEff
HealpixSubsetSlicer
WFD g band
Map of Min seeingEff (seeingFwhmEff) for WFD g band.
Min seeingEff
HealpixSubsetSlicer
WFD r band
Map of Min seeingEff (seeingFwhmEff) for WFD r band.
Min seeingEff
HealpixSubsetSlicer
WFD i band
Map of Min seeingEff (seeingFwhmEff) for WFD i band.
Min seeingEff
HealpixSubsetSlicer
WFD z band
Map of Min seeingEff (seeingFwhmEff) for WFD z band.
Min seeingEff
HealpixSubsetSlicer
WFD y band
Map of Min seeingEff (seeingFwhmEff) for WFD y band.
seeingEff Histogram
OneDSlicer
WFD all bands
Histogram of seeingFwhmEff (seeingEff) for WFD all bands.
seeingEff Histogram
OneDSlicer
WFD u band
Histogram of seeingFwhmEff (seeingEff) for WFD u band.
seeingEff Histogram
OneDSlicer
WFD g band
Histogram of seeingFwhmEff (seeingEff) for WFD g band.
seeingEff Histogram
OneDSlicer
WFD r band
Histogram of seeingFwhmEff (seeingEff) for WFD r band.
seeingEff Histogram
OneDSlicer
WFD i band
Histogram of seeingFwhmEff (seeingEff) for WFD i band.
seeingEff Histogram
OneDSlicer
WFD z band
Histogram of seeingFwhmEff (seeingEff) for WFD z band.
seeingEff Histogram
OneDSlicer
WFD y band
Histogram of seeingFwhmEff (seeingEff) for WFD y band.
|
Group: Seeingeff; Subgroup: WFD; Slicer: HealpixSubsetSlicer
|
| Metric Name |
Info Label |
Median |
Mean |
Rms |
N(-3Sigma) |
N(+3Sigma) |
Count |
Min |
Max |
| Max seeingEff |
WFD all bands |
3.23
|
3.41
|
0.77
|
0
|
315
|
22469
|
1.95
|
7.08
|
| Median seeingEff |
WFD all bands |
1.03
|
1.03
|
0.08
|
0
|
131
|
22469
|
0.87
|
1.31
|
| Min seeingEff |
WFD all bands |
0.58
|
0.58
|
0.04
|
0
|
59
|
22469
|
0.48
|
0.73
|
| Max seeingEff |
WFD u band |
2.41
|
2.52
|
0.54
|
0
|
244
|
22469
|
1.36
|
6.53
|
| Median seeingEff |
WFD u band |
1.23
|
1.24
|
0.10
|
1
|
133
|
22469
|
0.92
|
1.70
|
| Min seeingEff |
WFD u band |
0.77
|
0.77
|
0.08
|
46
|
67
|
22469
|
0.50
|
1.14
|
| Max seeingEff |
WFD g band |
2.48
|
2.59
|
0.58
|
0
|
312
|
22469
|
1.45
|
6.04
|
| Median seeingEff |
WFD g band |
1.10
|
1.11
|
0.10
|
0
|
53
|
22469
|
0.86
|
1.52
|
| Min seeingEff |
WFD g band |
0.66
|
0.66
|
0.06
|
11
|
146
|
22469
|
0.49
|
0.98
|
| Max seeingEff |
WFD r band |
2.64
|
2.76
|
0.60
|
0
|
373
|
22469
|
1.54
|
6.57
|
| Median seeingEff |
WFD r band |
1.03
|
1.03
|
0.09
|
0
|
107
|
22469
|
0.85
|
1.44
|
| Min seeingEff |
WFD r band |
0.62
|
0.62
|
0.04
|
0
|
148
|
22469
|
0.51
|
0.82
|
| Max seeingEff |
WFD i band |
2.55
|
2.69
|
0.67
|
0
|
505
|
22469
|
1.49
|
7.08
|
| Median seeingEff |
WFD i band |
0.99
|
0.99
|
0.08
|
0
|
76
|
22469
|
0.81
|
1.28
|
| Min seeingEff |
WFD i band |
0.61
|
0.61
|
0.04
|
12
|
75
|
22469
|
0.48
|
0.79
|
| Max seeingEff |
WFD z band |
2.50
|
2.68
|
0.73
|
0
|
499
|
22469
|
1.54
|
6.64
|
| Median seeingEff |
WFD z band |
1.00
|
1.01
|
0.07
|
0
|
78
|
22469
|
0.83
|
1.28
|
| Min seeingEff |
WFD z band |
0.61
|
0.61
|
0.04
|
0
|
40
|
22469
|
0.48
|
0.79
|
| Max seeingEff |
WFD y band |
2.30
|
2.42
|
0.59
|
0
|
448
|
22469
|
1.40
|
5.45
|
| Median seeingEff |
WFD y band |
1.00
|
1.00
|
0.07
|
0
|
70
|
22469
|
0.84
|
1.27
|
| Min seeingEff |
WFD y band |
0.62
|
0.63
|
0.04
|
0
|
132
|
22469
|
0.49
|
0.83
|
|
Group: Seeingeff; Subgroup: WFD; Slicer: UniSlicer
|
| |
25th%ile seeingEff |
75th%ile seeingEff |
Count seeingEff |
Max seeingEff |
Mean seeingEff |
Median seeingEff |
Min seeingEff |
N(+3Sigma) seeingEff |
N(-3Sigma) seeingEff |
Rms seeingEff |
| WFD all bands |
0.86
|
1.27
|
2147095
|
7.08
|
1.11
|
1.03
|
0.48
|
32973
|
0
|
0.36
|
| WFD g band |
0.91
|
1.39
|
196987
|
6.04
|
1.20
|
1.12
|
0.49
|
3044
|
0
|
0.41
|
| WFD i band |
0.84
|
1.24
|
500895
|
7.08
|
1.09
|
1.00
|
0.48
|
7967
|
0
|
0.36
|
| WFD r band |
0.86
|
1.29
|
489465
|
6.57
|
1.12
|
1.04
|
0.49
|
7351
|
0
|
0.37
|
| WFD u band |
1.04
|
1.49
|
124477
|
6.53
|
1.31
|
1.24
|
0.50
|
1699
|
0
|
0.39
|
| WFD y band |
0.86
|
1.20
|
394073
|
5.45
|
1.06
|
1.00
|
0.49
|
5692
|
0
|
0.31
|
| WFD z band |
0.85
|
1.23
|
441198
|
6.64
|
1.09
|
1.01
|
0.48
|
6728
|
0
|
0.35
|
Group: Seeingeff; Subgroup: Yr 1
Max seeingEff
HealpixSlicer
Yr 1 all bands
Map of Max seeingEff (seeingFwhmEff) for Yr 1 all bands.
Max seeingEff
HealpixSlicer
Yr 1 u band
Map of Max seeingEff (seeingFwhmEff) for Yr 1 u band.
Max seeingEff
HealpixSlicer
Yr 1 g band
Map of Max seeingEff (seeingFwhmEff) for Yr 1 g band.
Max seeingEff
HealpixSlicer
Yr 1 r band
Map of Max seeingEff (seeingFwhmEff) for Yr 1 r band.
Max seeingEff
HealpixSlicer
Yr 1 i band
Map of Max seeingEff (seeingFwhmEff) for Yr 1 i band.
Max seeingEff
HealpixSlicer
Yr 1 z band
Map of Max seeingEff (seeingFwhmEff) for Yr 1 z band.
Max seeingEff
HealpixSlicer
Yr 1 y band
Map of Max seeingEff (seeingFwhmEff) for Yr 1 y band.
Median seeingEff
HealpixSlicer
Yr 1 all bands
Map of Median seeingEff (seeingFwhmEff) for Yr 1 all bands.
Median seeingEff
HealpixSlicer
Yr 1 u band
Map of Median seeingEff (seeingFwhmEff) for Yr 1 u band.
Median seeingEff
HealpixSlicer
Yr 1 g band
Map of Median seeingEff (seeingFwhmEff) for Yr 1 g band.
Median seeingEff
HealpixSlicer
Yr 1 r band
Map of Median seeingEff (seeingFwhmEff) for Yr 1 r band.
Median seeingEff
HealpixSlicer
Yr 1 i band
Map of Median seeingEff (seeingFwhmEff) for Yr 1 i band.
Median seeingEff
HealpixSlicer
Yr 1 z band
Map of Median seeingEff (seeingFwhmEff) for Yr 1 z band.
Median seeingEff
HealpixSlicer
Yr 1 y band
Map of Median seeingEff (seeingFwhmEff) for Yr 1 y band.
Min seeingEff
HealpixSlicer
Yr 1 all bands
Map of Min seeingEff (seeingFwhmEff) for Yr 1 all bands.
Min seeingEff
HealpixSlicer
Yr 1 u band
Map of Min seeingEff (seeingFwhmEff) for Yr 1 u band.
Min seeingEff
HealpixSlicer
Yr 1 g band
Map of Min seeingEff (seeingFwhmEff) for Yr 1 g band.
Min seeingEff
HealpixSlicer
Yr 1 r band
Map of Min seeingEff (seeingFwhmEff) for Yr 1 r band.
Min seeingEff
HealpixSlicer
Yr 1 i band
Map of Min seeingEff (seeingFwhmEff) for Yr 1 i band.
Min seeingEff
HealpixSlicer
Yr 1 z band
Map of Min seeingEff (seeingFwhmEff) for Yr 1 z band.
Min seeingEff
HealpixSlicer
Yr 1 y band
Map of Min seeingEff (seeingFwhmEff) for Yr 1 y band.
seeingEff Histogram
OneDSlicer
Yr 1 all bands
Histogram of seeingFwhmEff (seeingEff) for Yr 1 all bands.
seeingEff Histogram
OneDSlicer
Yr 1 u band
Histogram of seeingFwhmEff (seeingEff) for Yr 1 u band.
seeingEff Histogram
OneDSlicer
Yr 1 g band
Histogram of seeingFwhmEff (seeingEff) for Yr 1 g band.
seeingEff Histogram
OneDSlicer
Yr 1 r band
Histogram of seeingFwhmEff (seeingEff) for Yr 1 r band.
seeingEff Histogram
OneDSlicer
Yr 1 i band
Histogram of seeingFwhmEff (seeingEff) for Yr 1 i band.
seeingEff Histogram
OneDSlicer
Yr 1 z band
Histogram of seeingFwhmEff (seeingEff) for Yr 1 z band.
seeingEff Histogram
OneDSlicer
Yr 1 y band
Histogram of seeingFwhmEff (seeingEff) for Yr 1 y band.
|
Group: Seeingeff; Subgroup: Yr 1; Slicer: HealpixSlicer
|
| Metric Name |
Info Label |
Median |
Mean |
Rms |
N(-3Sigma) |
N(+3Sigma) |
Count |
Min |
Max |
| Max seeingEff |
Yr 1 all bands |
1.97
|
2.08
|
0.52
|
0
|
419
|
33393
|
0.85
|
5.06
|
| Median seeingEff |
Yr 1 all bands |
0.96
|
0.99
|
0.13
|
0
|
490
|
33393
|
0.73
|
3.05
|
| Min seeingEff |
Yr 1 all bands |
0.63
|
0.66
|
0.11
|
0
|
775
|
33393
|
0.48
|
2.72
|
| Max seeingEff |
Yr 1 u band |
1.51
|
1.57
|
0.39
|
0
|
575
|
29487
|
0.69
|
3.83
|
| Median seeingEff |
Yr 1 u band |
1.12
|
1.13
|
0.20
|
0
|
239
|
29487
|
0.68
|
3.07
|
| Min seeingEff |
Yr 1 u band |
0.84
|
0.88
|
0.18
|
0
|
342
|
29487
|
0.56
|
3.07
|
| Max seeingEff |
Yr 1 g band |
1.48
|
1.57
|
0.43
|
0
|
650
|
33183
|
0.64
|
4.99
|
| Median seeingEff |
Yr 1 g band |
1.04
|
1.07
|
0.20
|
0
|
340
|
33183
|
0.59
|
3.09
|
| Min seeingEff |
Yr 1 g band |
0.76
|
0.81
|
0.18
|
0
|
516
|
33183
|
0.52
|
3.09
|
| Max seeingEff |
Yr 1 r band |
1.51
|
1.58
|
0.38
|
0
|
416
|
33246
|
0.73
|
4.04
|
| Median seeingEff |
Yr 1 r band |
0.94
|
0.98
|
0.17
|
0
|
483
|
33246
|
0.64
|
2.53
|
| Min seeingEff |
Yr 1 r band |
0.68
|
0.72
|
0.14
|
0
|
870
|
33246
|
0.52
|
2.53
|
| Max seeingEff |
Yr 1 i band |
1.49
|
1.61
|
0.48
|
0
|
593
|
33311
|
0.72
|
5.06
|
| Median seeingEff |
Yr 1 i band |
0.93
|
0.96
|
0.16
|
0
|
620
|
33311
|
0.66
|
3.10
|
| Min seeingEff |
Yr 1 i band |
0.68
|
0.72
|
0.13
|
0
|
554
|
33311
|
0.48
|
2.94
|
| Max seeingEff |
Yr 1 z band |
1.50
|
1.57
|
0.41
|
0
|
613
|
33255
|
0.68
|
4.16
|
| Median seeingEff |
Yr 1 z band |
0.95
|
0.99
|
0.17
|
0
|
576
|
33255
|
0.59
|
3.37
|
| Min seeingEff |
Yr 1 z band |
0.70
|
0.73
|
0.14
|
0
|
596
|
33255
|
0.50
|
3.37
|
| Max seeingEff |
Yr 1 y band |
1.44
|
1.50
|
0.36
|
0
|
611
|
29670
|
0.66
|
4.09
|
| Median seeingEff |
Yr 1 y band |
0.94
|
0.96
|
0.12
|
0
|
276
|
29670
|
0.66
|
2.62
|
| Min seeingEff |
Yr 1 y band |
0.71
|
0.72
|
0.10
|
0
|
412
|
29670
|
0.53
|
2.02
|
|
Group: Seeingeff; Subgroup: Yr 1; Slicer: UniSlicer
|
| |
25th%ile seeingEff |
75th%ile seeingEff |
Count seeingEff |
Max seeingEff |
Mean seeingEff |
Median seeingEff |
Min seeingEff |
N(+3Sigma) seeingEff |
N(-3Sigma) seeingEff |
Rms seeingEff |
| Yr 1 all bands |
0.81
|
1.16
|
241913
|
5.06
|
1.02
|
0.95
|
0.48
|
3714
|
0
|
0.30
|
| Yr 1 g band |
0.86
|
1.27
|
23394
|
4.99
|
1.10
|
1.04
|
0.52
|
342
|
0
|
0.34
|
| Yr 1 i band |
0.79
|
1.11
|
56225
|
5.06
|
0.99
|
0.92
|
0.48
|
900
|
0
|
0.30
|
| Yr 1 r band |
0.80
|
1.15
|
50660
|
4.04
|
1.01
|
0.94
|
0.52
|
823
|
0
|
0.30
|
| Yr 1 u band |
0.91
|
1.32
|
16822
|
3.83
|
1.16
|
1.11
|
0.56
|
241
|
0
|
0.34
|
| Yr 1 y band |
0.82
|
1.12
|
49401
|
4.09
|
1.00
|
0.94
|
0.53
|
631
|
0
|
0.26
|
| Yr 1 z band |
0.81
|
1.14
|
45411
|
4.16
|
1.01
|
0.94
|
0.50
|
730
|
0
|
0.30
|
Group: Seeinggeom; Subgroup: Yr 1
Max seeingGeom
HealpixSlicer
Yr 1 all bands
Map of Max seeingGeom (seeingFwhmGeom) for Yr 1 all bands.
Max seeingGeom
HealpixSlicer
Yr 1 u band
Map of Max seeingGeom (seeingFwhmGeom) for Yr 1 u band.
Max seeingGeom
HealpixSlicer
Yr 1 g band
Map of Max seeingGeom (seeingFwhmGeom) for Yr 1 g band.
Max seeingGeom
HealpixSlicer
Yr 1 r band
Map of Max seeingGeom (seeingFwhmGeom) for Yr 1 r band.
Max seeingGeom
HealpixSlicer
Yr 1 i band
Map of Max seeingGeom (seeingFwhmGeom) for Yr 1 i band.
Max seeingGeom
HealpixSlicer
Yr 1 z band
Map of Max seeingGeom (seeingFwhmGeom) for Yr 1 z band.
Max seeingGeom
HealpixSlicer
Yr 1 y band
Map of Max seeingGeom (seeingFwhmGeom) for Yr 1 y band.
Median seeingGeom
HealpixSlicer
Yr 1 all bands
Map of Median seeingGeom (seeingFwhmGeom) for Yr 1 all bands.
Median seeingGeom
HealpixSlicer
Yr 1 u band
Map of Median seeingGeom (seeingFwhmGeom) for Yr 1 u band.
Median seeingGeom
HealpixSlicer
Yr 1 g band
Map of Median seeingGeom (seeingFwhmGeom) for Yr 1 g band.
Median seeingGeom
HealpixSlicer
Yr 1 r band
Map of Median seeingGeom (seeingFwhmGeom) for Yr 1 r band.
Median seeingGeom
HealpixSlicer
Yr 1 i band
Map of Median seeingGeom (seeingFwhmGeom) for Yr 1 i band.
Median seeingGeom
HealpixSlicer
Yr 1 z band
Map of Median seeingGeom (seeingFwhmGeom) for Yr 1 z band.
Median seeingGeom
HealpixSlicer
Yr 1 y band
Map of Median seeingGeom (seeingFwhmGeom) for Yr 1 y band.
Min seeingGeom
HealpixSlicer
Yr 1 all bands
Map of Min seeingGeom (seeingFwhmGeom) for Yr 1 all bands.
Min seeingGeom
HealpixSlicer
Yr 1 u band
Map of Min seeingGeom (seeingFwhmGeom) for Yr 1 u band.
Min seeingGeom
HealpixSlicer
Yr 1 g band
Map of Min seeingGeom (seeingFwhmGeom) for Yr 1 g band.
Min seeingGeom
HealpixSlicer
Yr 1 r band
Map of Min seeingGeom (seeingFwhmGeom) for Yr 1 r band.
Min seeingGeom
HealpixSlicer
Yr 1 i band
Map of Min seeingGeom (seeingFwhmGeom) for Yr 1 i band.
Min seeingGeom
HealpixSlicer
Yr 1 z band
Map of Min seeingGeom (seeingFwhmGeom) for Yr 1 z band.
Min seeingGeom
HealpixSlicer
Yr 1 y band
Map of Min seeingGeom (seeingFwhmGeom) for Yr 1 y band.
seeingGeom Histogram
OneDSlicer
Yr 1 all bands
Histogram of seeingFwhmGeom (seeingGeom) for Yr 1 all bands.
seeingGeom Histogram
OneDSlicer
Yr 1 u band
Histogram of seeingFwhmGeom (seeingGeom) for Yr 1 u band.
seeingGeom Histogram
OneDSlicer
Yr 1 g band
Histogram of seeingFwhmGeom (seeingGeom) for Yr 1 g band.
seeingGeom Histogram
OneDSlicer
Yr 1 r band
Histogram of seeingFwhmGeom (seeingGeom) for Yr 1 r band.
seeingGeom Histogram
OneDSlicer
Yr 1 i band
Histogram of seeingFwhmGeom (seeingGeom) for Yr 1 i band.
seeingGeom Histogram
OneDSlicer
Yr 1 z band
Histogram of seeingFwhmGeom (seeingGeom) for Yr 1 z band.
seeingGeom Histogram
OneDSlicer
Yr 1 y band
Histogram of seeingFwhmGeom (seeingGeom) for Yr 1 y band.
|
Group: Seeinggeom; Subgroup: Yr 1; Slicer: HealpixSlicer
|
| Metric Name |
Info Label |
Median |
Mean |
Rms |
N(-3Sigma) |
N(+3Sigma) |
Count |
Min |
Max |
| Max seeingGeom |
Yr 1 all bands |
1.67
|
1.76
|
0.43
|
0
|
419
|
33393
|
0.75
|
4.21
|
| Median seeingGeom |
Yr 1 all bands |
0.84
|
0.87
|
0.11
|
0
|
490
|
33393
|
0.66
|
2.56
|
| Min seeingGeom |
Yr 1 all bands |
0.57
|
0.60
|
0.09
|
0
|
775
|
33393
|
0.45
|
2.29
|
| Max seeingGeom |
Yr 1 u band |
1.29
|
1.34
|
0.32
|
0
|
575
|
29487
|
0.62
|
3.20
|
| Median seeingGeom |
Yr 1 u band |
0.97
|
0.98
|
0.17
|
0
|
239
|
29487
|
0.61
|
2.58
|
| Min seeingGeom |
Yr 1 u band |
0.74
|
0.77
|
0.15
|
0
|
342
|
29487
|
0.51
|
2.58
|
| Max seeingGeom |
Yr 1 g band |
1.27
|
1.34
|
0.36
|
0
|
650
|
33183
|
0.58
|
4.16
|
| Median seeingGeom |
Yr 1 g band |
0.91
|
0.93
|
0.16
|
0
|
340
|
33183
|
0.53
|
2.59
|
| Min seeingGeom |
Yr 1 g band |
0.68
|
0.72
|
0.15
|
0
|
516
|
33183
|
0.48
|
2.59
|
| Max seeingGeom |
Yr 1 r band |
1.29
|
1.35
|
0.31
|
0
|
416
|
33246
|
0.65
|
3.37
|
| Median seeingGeom |
Yr 1 r band |
0.82
|
0.86
|
0.14
|
0
|
483
|
33246
|
0.58
|
2.13
|
| Min seeingGeom |
Yr 1 r band |
0.61
|
0.64
|
0.11
|
0
|
870
|
33246
|
0.48
|
2.13
|
| Max seeingGeom |
Yr 1 i band |
1.28
|
1.37
|
0.40
|
0
|
593
|
33311
|
0.64
|
4.21
|
| Median seeingGeom |
Yr 1 i band |
0.82
|
0.84
|
0.13
|
0
|
620
|
33311
|
0.60
|
2.60
|
| Min seeingGeom |
Yr 1 i band |
0.61
|
0.64
|
0.11
|
0
|
554
|
33311
|
0.45
|
2.47
|
| Max seeingGeom |
Yr 1 z band |
1.28
|
1.35
|
0.34
|
0
|
613
|
33255
|
0.61
|
3.47
|
| Median seeingGeom |
Yr 1 z band |
0.84
|
0.86
|
0.14
|
0
|
576
|
33255
|
0.54
|
2.82
|
| Min seeingGeom |
Yr 1 z band |
0.62
|
0.65
|
0.12
|
0
|
596
|
33255
|
0.46
|
2.82
|
| Max seeingGeom |
Yr 1 y band |
1.23
|
1.29
|
0.29
|
0
|
611
|
29670
|
0.59
|
3.41
|
| Median seeingGeom |
Yr 1 y band |
0.83
|
0.84
|
0.10
|
0
|
276
|
29670
|
0.59
|
2.20
|
| Min seeingGeom |
Yr 1 y band |
0.63
|
0.64
|
0.08
|
0
|
412
|
29670
|
0.49
|
1.71
|
|
Group: Seeinggeom; Subgroup: Yr 1; Slicer: UniSlicer
|
| |
25th%ile seeingGeom |
75th%ile seeingGeom |
Count seeingGeom |
Max seeingGeom |
Mean seeingGeom |
Median seeingGeom |
Min seeingGeom |
N(+3Sigma) seeingGeom |
N(-3Sigma) seeingGeom |
Rms seeingGeom |
| Yr 1 all bands |
0.72
|
1.01
|
241913
|
4.21
|
0.89
|
0.84
|
0.45
|
3714
|
0
|
0.25
|
| Yr 1 g band |
0.76
|
1.10
|
23394
|
4.16
|
0.96
|
0.91
|
0.48
|
342
|
0
|
0.28
|
| Yr 1 i band |
0.70
|
0.96
|
56225
|
4.21
|
0.87
|
0.81
|
0.45
|
900
|
0
|
0.25
|
| Yr 1 r band |
0.71
|
0.99
|
50660
|
3.37
|
0.88
|
0.82
|
0.48
|
823
|
0
|
0.24
|
| Yr 1 u band |
0.80
|
1.14
|
16822
|
3.20
|
1.00
|
0.96
|
0.51
|
241
|
0
|
0.28
|
| Yr 1 y band |
0.73
|
0.98
|
49401
|
3.41
|
0.87
|
0.83
|
0.49
|
631
|
0
|
0.21
|
| Yr 1 z band |
0.72
|
0.99
|
45411
|
3.47
|
0.89
|
0.83
|
0.46
|
730
|
0
|
0.25
|
Group: Skybrightness; Subgroup: All sky
Max skyBrightness
HealpixSlicer
All sky all bands
Map of Max skyBrightness for All sky all bands.
Max skyBrightness
HealpixSlicer
All sky u band
Map of Max skyBrightness for All sky u band.
Max skyBrightness
HealpixSlicer
All sky g band
Map of Max skyBrightness for All sky g band.
Max skyBrightness
HealpixSlicer
All sky r band
Map of Max skyBrightness for All sky r band.
Max skyBrightness
HealpixSlicer
All sky i band
Map of Max skyBrightness for All sky i band.
Max skyBrightness
HealpixSlicer
All sky z band
Map of Max skyBrightness for All sky z band.
Max skyBrightness
HealpixSlicer
All sky y band
Map of Max skyBrightness for All sky y band.
Median skyBrightness
HealpixSlicer
All sky all bands
Map of Median skyBrightness for All sky all bands.
Median skyBrightness
HealpixSlicer
All sky u band
Map of Median skyBrightness for All sky u band.
Median skyBrightness
HealpixSlicer
All sky g band
Map of Median skyBrightness for All sky g band.
Median skyBrightness
HealpixSlicer
All sky r band
Map of Median skyBrightness for All sky r band.
Median skyBrightness
HealpixSlicer
All sky i band
Map of Median skyBrightness for All sky i band.
Median skyBrightness
HealpixSlicer
All sky z band
Map of Median skyBrightness for All sky z band.
Median skyBrightness
HealpixSlicer
All sky y band
Map of Median skyBrightness for All sky y band.
Min skyBrightness
HealpixSlicer
All sky all bands
Map of Min skyBrightness for All sky all bands.
Min skyBrightness
HealpixSlicer
All sky u band
Map of Min skyBrightness for All sky u band.
Min skyBrightness
HealpixSlicer
All sky g band
Map of Min skyBrightness for All sky g band.
Min skyBrightness
HealpixSlicer
All sky r band
Map of Min skyBrightness for All sky r band.
Min skyBrightness
HealpixSlicer
All sky i band
Map of Min skyBrightness for All sky i band.
Min skyBrightness
HealpixSlicer
All sky z band
Map of Min skyBrightness for All sky z band.
Min skyBrightness
HealpixSlicer
All sky y band
Map of Min skyBrightness for All sky y band.
skyBrightness Histogram
OneDSlicer
All sky all bands
Histogram of skyBrightness for All sky all bands.
skyBrightness Histogram
OneDSlicer
All sky u band
Histogram of skyBrightness for All sky u band.
skyBrightness Histogram
OneDSlicer
All sky g band
Histogram of skyBrightness for All sky g band.
skyBrightness Histogram
OneDSlicer
All sky r band
Histogram of skyBrightness for All sky r band.
skyBrightness Histogram
OneDSlicer
All sky i band
Histogram of skyBrightness for All sky i band.
skyBrightness Histogram
OneDSlicer
All sky z band
Histogram of skyBrightness for All sky z band.
skyBrightness Histogram
OneDSlicer
All sky y band
Histogram of skyBrightness for All sky y band.
|
Group: Skybrightness; Subgroup: All sky; Slicer: HealpixSlicer
|
| Metric Name |
Info Label |
Median |
Mean |
Rms |
N(-3Sigma) |
N(+3Sigma) |
Count |
Min |
Max |
| Max skyBrightness |
All sky all bands |
22.68
|
22.60
|
0.29
|
104
|
0
|
33578
|
18.24
|
22.81
|
| Median skyBrightness |
All sky all bands |
19.78
|
19.79
|
0.24
|
80
|
290
|
33578
|
18.13
|
22.59
|
| Min skyBrightness |
All sky all bands |
17.00
|
17.10
|
0.45
|
73
|
167
|
33578
|
15.35
|
22.59
|
| Max skyBrightness |
All sky u band |
22.69
|
22.69
|
0.06
|
33
|
0
|
29864
|
22.03
|
22.81
|
| Median skyBrightness |
All sky u band |
22.64
|
22.64
|
0.06
|
51
|
0
|
29864
|
22.03
|
22.78
|
| Min skyBrightness |
All sky u band |
22.12
|
22.14
|
0.24
|
0
|
0
|
29864
|
21.53
|
22.73
|
| Max skyBrightness |
All sky g band |
22.13
|
22.13
|
0.14
|
22
|
0
|
33481
|
19.60
|
22.37
|
| Median skyBrightness |
All sky g band |
22.05
|
22.04
|
0.13
|
39
|
0
|
33481
|
19.60
|
22.32
|
| Min skyBrightness |
All sky g band |
19.98
|
19.98
|
0.79
|
0
|
0
|
33481
|
17.78
|
22.14
|
| Max skyBrightness |
All sky r band |
21.18
|
21.18
|
0.14
|
335
|
0
|
33540
|
19.32
|
21.39
|
| Median skyBrightness |
All sky r band |
21.06
|
21.05
|
0.13
|
145
|
0
|
33540
|
19.32
|
21.31
|
| Min skyBrightness |
All sky r band |
18.85
|
18.83
|
0.55
|
0
|
271
|
33540
|
17.54
|
21.14
|
| Max skyBrightness |
All sky i band |
20.34
|
20.30
|
0.15
|
589
|
0
|
33538
|
18.24
|
20.48
|
| Median skyBrightness |
All sky i band |
19.98
|
19.93
|
0.19
|
576
|
0
|
33538
|
18.24
|
20.36
|
| Min skyBrightness |
All sky i band |
18.10
|
18.12
|
0.43
|
0
|
120
|
33538
|
17.14
|
20.12
|
| Max skyBrightness |
All sky z band |
19.42
|
19.36
|
0.15
|
674
|
0
|
33510
|
17.65
|
19.53
|
| Median skyBrightness |
All sky z band |
19.02
|
18.99
|
0.14
|
328
|
0
|
33510
|
17.64
|
19.41
|
| Min skyBrightness |
All sky z band |
17.39
|
17.45
|
0.58
|
0
|
1
|
33510
|
16.37
|
19.31
|
| Max skyBrightness |
All sky y band |
18.54
|
18.50
|
0.11
|
629
|
0
|
29952
|
16.91
|
18.62
|
| Median skyBrightness |
All sky y band |
18.27
|
18.25
|
0.10
|
372
|
0
|
29952
|
16.91
|
18.45
|
| Min skyBrightness |
All sky y band |
17.17
|
17.20
|
0.40
|
201
|
0
|
29952
|
15.35
|
18.38
|
|
Group: Skybrightness; Subgroup: All sky; Slicer: UniSlicer
|
| |
25th%ile skyBrightness |
75th%ile skyBrightness |
Count skyBrightness |
Max skyBrightness |
Mean skyBrightness |
Median skyBrightness |
Min skyBrightness |
N(+3Sigma) skyBrightness |
N(-3Sigma) skyBrightness |
Rms skyBrightness |
| All sky all bands |
18.76
|
21.06
|
2147095
|
22.81
|
19.92
|
19.80
|
15.35
|
0
|
8
|
1.37
|
| All sky g band |
21.85
|
22.14
|
196987
|
22.37
|
21.85
|
22.01
|
17.78
|
0
|
5259
|
0.53
|
| All sky i band |
19.46
|
20.24
|
500895
|
20.48
|
19.80
|
19.99
|
17.14
|
0
|
5587
|
0.55
|
| All sky r band |
20.74
|
21.16
|
489465
|
21.39
|
20.83
|
21.05
|
17.54
|
0
|
10283
|
0.56
|
| All sky u band |
22.57
|
22.69
|
124477
|
22.81
|
22.61
|
22.63
|
21.53
|
0
|
3277
|
0.14
|
| All sky y band |
18.11
|
18.39
|
394073
|
18.62
|
18.22
|
18.27
|
15.35
|
0
|
5892
|
0.24
|
| All sky z band |
18.76
|
19.28
|
441198
|
19.53
|
18.95
|
19.05
|
16.37
|
0
|
8534
|
0.43
|
Group: Skybrightness; Subgroup: WFD
Max skyBrightness
HealpixSubsetSlicer
WFD all bands
Map of Max skyBrightness for WFD all bands.
Max skyBrightness
HealpixSubsetSlicer
WFD u band
Map of Max skyBrightness for WFD u band.
Max skyBrightness
HealpixSubsetSlicer
WFD g band
Map of Max skyBrightness for WFD g band.
Max skyBrightness
HealpixSubsetSlicer
WFD r band
Map of Max skyBrightness for WFD r band.
Max skyBrightness
HealpixSubsetSlicer
WFD i band
Map of Max skyBrightness for WFD i band.
Max skyBrightness
HealpixSubsetSlicer
WFD z band
Map of Max skyBrightness for WFD z band.
Max skyBrightness
HealpixSubsetSlicer
WFD y band
Map of Max skyBrightness for WFD y band.
Median skyBrightness
HealpixSubsetSlicer
WFD all bands
Map of Median skyBrightness for WFD all bands.
Median skyBrightness
HealpixSubsetSlicer
WFD u band
Map of Median skyBrightness for WFD u band.
Median skyBrightness
HealpixSubsetSlicer
WFD g band
Map of Median skyBrightness for WFD g band.
Median skyBrightness
HealpixSubsetSlicer
WFD r band
Map of Median skyBrightness for WFD r band.
Median skyBrightness
HealpixSubsetSlicer
WFD i band
Map of Median skyBrightness for WFD i band.
Median skyBrightness
HealpixSubsetSlicer
WFD z band
Map of Median skyBrightness for WFD z band.
Median skyBrightness
HealpixSubsetSlicer
WFD y band
Map of Median skyBrightness for WFD y band.
Min skyBrightness
HealpixSubsetSlicer
WFD all bands
Map of Min skyBrightness for WFD all bands.
Min skyBrightness
HealpixSubsetSlicer
WFD u band
Map of Min skyBrightness for WFD u band.
Min skyBrightness
HealpixSubsetSlicer
WFD g band
Map of Min skyBrightness for WFD g band.
Min skyBrightness
HealpixSubsetSlicer
WFD r band
Map of Min skyBrightness for WFD r band.
Min skyBrightness
HealpixSubsetSlicer
WFD i band
Map of Min skyBrightness for WFD i band.
Min skyBrightness
HealpixSubsetSlicer
WFD z band
Map of Min skyBrightness for WFD z band.
Min skyBrightness
HealpixSubsetSlicer
WFD y band
Map of Min skyBrightness for WFD y band.
skyBrightness Histogram
OneDSlicer
WFD all bands
Histogram of skyBrightness for WFD all bands.
skyBrightness Histogram
OneDSlicer
WFD u band
Histogram of skyBrightness for WFD u band.
skyBrightness Histogram
OneDSlicer
WFD g band
Histogram of skyBrightness for WFD g band.
skyBrightness Histogram
OneDSlicer
WFD r band
Histogram of skyBrightness for WFD r band.
skyBrightness Histogram
OneDSlicer
WFD i band
Histogram of skyBrightness for WFD i band.
skyBrightness Histogram
OneDSlicer
WFD z band
Histogram of skyBrightness for WFD z band.
skyBrightness Histogram
OneDSlicer
WFD y band
Histogram of skyBrightness for WFD y band.
|
Group: Skybrightness; Subgroup: WFD; Slicer: HealpixSubsetSlicer
|
| Metric Name |
Info Label |
Median |
Mean |
Rms |
N(-3Sigma) |
N(+3Sigma) |
Count |
Min |
Max |
| Max skyBrightness |
WFD all bands |
22.70
|
22.70
|
0.06
|
0
|
0
|
22469
|
22.53
|
22.81
|
| Median skyBrightness |
WFD all bands |
19.74
|
19.75
|
0.18
|
0
|
30
|
22469
|
19.24
|
20.31
|
| Min skyBrightness |
WFD all bands |
16.93
|
16.95
|
0.31
|
180
|
16
|
22469
|
15.35
|
17.96
|
| Max skyBrightness |
WFD u band |
22.70
|
22.70
|
0.06
|
0
|
0
|
22469
|
22.53
|
22.81
|
| Median skyBrightness |
WFD u band |
22.65
|
22.65
|
0.05
|
0
|
0
|
22469
|
22.49
|
22.78
|
| Min skyBrightness |
WFD u band |
22.10
|
22.11
|
0.22
|
0
|
0
|
22469
|
21.53
|
22.63
|
| Max skyBrightness |
WFD g band |
22.17
|
22.16
|
0.11
|
0
|
0
|
22469
|
21.91
|
22.37
|
| Median skyBrightness |
WFD g band |
22.07
|
22.07
|
0.11
|
0
|
0
|
22469
|
21.76
|
22.32
|
| Min skyBrightness |
WFD g band |
19.85
|
19.84
|
0.70
|
0
|
2
|
22469
|
17.78
|
21.94
|
| Max skyBrightness |
WFD r band |
21.23
|
21.22
|
0.09
|
0
|
0
|
22469
|
20.96
|
21.39
|
| Median skyBrightness |
WFD r band |
21.10
|
21.10
|
0.09
|
8
|
0
|
22469
|
20.82
|
21.31
|
| Min skyBrightness |
WFD r band |
18.74
|
18.69
|
0.47
|
0
|
0
|
22469
|
17.54
|
19.90
|
| Max skyBrightness |
WFD i band |
20.36
|
20.35
|
0.08
|
127
|
0
|
22469
|
20.04
|
20.48
|
| Median skyBrightness |
WFD i band |
20.01
|
20.00
|
0.10
|
112
|
3
|
22469
|
19.56
|
20.36
|
| Min skyBrightness |
WFD i band |
17.95
|
18.04
|
0.41
|
0
|
0
|
22469
|
17.14
|
19.10
|
| Max skyBrightness |
WFD z band |
19.44
|
19.42
|
0.08
|
211
|
0
|
22469
|
19.09
|
19.53
|
| Median skyBrightness |
WFD z band |
19.05
|
19.05
|
0.09
|
84
|
4
|
22469
|
18.70
|
19.41
|
| Min skyBrightness |
WFD z band |
17.16
|
17.33
|
0.53
|
0
|
0
|
22469
|
16.37
|
18.67
|
| Max skyBrightness |
WFD y band |
18.55
|
18.52
|
0.07
|
261
|
0
|
22469
|
18.18
|
18.62
|
| Median skyBrightness |
WFD y band |
18.28
|
18.26
|
0.08
|
221
|
0
|
22469
|
17.92
|
18.45
|
| Min skyBrightness |
WFD y band |
17.11
|
17.11
|
0.35
|
189
|
0
|
22469
|
15.35
|
17.96
|
|
Group: Skybrightness; Subgroup: WFD; Slicer: UniSlicer
|
| |
25th%ile skyBrightness |
75th%ile skyBrightness |
Count skyBrightness |
Max skyBrightness |
Mean skyBrightness |
Median skyBrightness |
Min skyBrightness |
N(+3Sigma) skyBrightness |
N(-3Sigma) skyBrightness |
Rms skyBrightness |
| WFD all bands |
18.76
|
21.06
|
2147095
|
22.81
|
19.92
|
19.80
|
15.35
|
0
|
8
|
1.37
|
| WFD g band |
21.85
|
22.14
|
196987
|
22.37
|
21.85
|
22.01
|
17.78
|
0
|
5259
|
0.53
|
| WFD i band |
19.46
|
20.24
|
500895
|
20.48
|
19.80
|
19.99
|
17.14
|
0
|
5587
|
0.55
|
| WFD r band |
20.74
|
21.16
|
489465
|
21.39
|
20.83
|
21.05
|
17.54
|
0
|
10283
|
0.56
|
| WFD u band |
22.57
|
22.69
|
124477
|
22.81
|
22.61
|
22.63
|
21.53
|
0
|
3277
|
0.14
|
| WFD y band |
18.11
|
18.39
|
394073
|
18.62
|
18.22
|
18.27
|
15.35
|
0
|
5892
|
0.24
|
| WFD z band |
18.76
|
19.28
|
441198
|
19.53
|
18.95
|
19.05
|
16.37
|
0
|
8534
|
0.43
|
Group: Skybrightness; Subgroup: Yr 1
Max skyBrightness
HealpixSlicer
Yr 1 all bands
Map of Max skyBrightness for Yr 1 all bands.
Max skyBrightness
HealpixSlicer
Yr 1 u band
Map of Max skyBrightness for Yr 1 u band.
Max skyBrightness
HealpixSlicer
Yr 1 g band
Map of Max skyBrightness for Yr 1 g band.
Max skyBrightness
HealpixSlicer
Yr 1 r band
Map of Max skyBrightness for Yr 1 r band.
Max skyBrightness
HealpixSlicer
Yr 1 i band
Map of Max skyBrightness for Yr 1 i band.
Max skyBrightness
HealpixSlicer
Yr 1 z band
Map of Max skyBrightness for Yr 1 z band.
Max skyBrightness
HealpixSlicer
Yr 1 y band
Map of Max skyBrightness for Yr 1 y band.
Median skyBrightness
HealpixSlicer
Yr 1 all bands
Map of Median skyBrightness for Yr 1 all bands.
Median skyBrightness
HealpixSlicer
Yr 1 u band
Map of Median skyBrightness for Yr 1 u band.
Median skyBrightness
HealpixSlicer
Yr 1 g band
Map of Median skyBrightness for Yr 1 g band.
Median skyBrightness
HealpixSlicer
Yr 1 r band
Map of Median skyBrightness for Yr 1 r band.
Median skyBrightness
HealpixSlicer
Yr 1 i band
Map of Median skyBrightness for Yr 1 i band.
Median skyBrightness
HealpixSlicer
Yr 1 z band
Map of Median skyBrightness for Yr 1 z band.
Median skyBrightness
HealpixSlicer
Yr 1 y band
Map of Median skyBrightness for Yr 1 y band.
Min skyBrightness
HealpixSlicer
Yr 1 all bands
Map of Min skyBrightness for Yr 1 all bands.
Min skyBrightness
HealpixSlicer
Yr 1 u band
Map of Min skyBrightness for Yr 1 u band.
Min skyBrightness
HealpixSlicer
Yr 1 g band
Map of Min skyBrightness for Yr 1 g band.
Min skyBrightness
HealpixSlicer
Yr 1 r band
Map of Min skyBrightness for Yr 1 r band.
Min skyBrightness
HealpixSlicer
Yr 1 i band
Map of Min skyBrightness for Yr 1 i band.
Min skyBrightness
HealpixSlicer
Yr 1 z band
Map of Min skyBrightness for Yr 1 z band.
Min skyBrightness
HealpixSlicer
Yr 1 y band
Map of Min skyBrightness for Yr 1 y band.
skyBrightness Histogram
OneDSlicer
Yr 1 all bands
Histogram of skyBrightness for Yr 1 all bands.
skyBrightness Histogram
OneDSlicer
Yr 1 u band
Histogram of skyBrightness for Yr 1 u band.
skyBrightness Histogram
OneDSlicer
Yr 1 g band
Histogram of skyBrightness for Yr 1 g band.
skyBrightness Histogram
OneDSlicer
Yr 1 r band
Histogram of skyBrightness for Yr 1 r band.
skyBrightness Histogram
OneDSlicer
Yr 1 i band
Histogram of skyBrightness for Yr 1 i band.
skyBrightness Histogram
OneDSlicer
Yr 1 z band
Histogram of skyBrightness for Yr 1 z band.
skyBrightness Histogram
OneDSlicer
Yr 1 y band
Histogram of skyBrightness for Yr 1 y band.
|
Group: Skybrightness; Subgroup: Yr 1; Slicer: HealpixSlicer
|
| Metric Name |
Info Label |
Median |
Mean |
Rms |
N(-3Sigma) |
N(+3Sigma) |
Count |
Min |
Max |
| Max skyBrightness |
Yr 1 all bands |
22.66
|
22.56
|
0.35
|
313
|
0
|
33393
|
17.91
|
22.81
|
| Median skyBrightness |
Yr 1 all bands |
19.83
|
19.82
|
0.39
|
68
|
228
|
33393
|
17.64
|
22.31
|
| Min skyBrightness |
Yr 1 all bands |
17.81
|
17.72
|
0.52
|
0
|
95
|
33393
|
16.31
|
22.05
|
| Max skyBrightness |
Yr 1 u band |
22.67
|
22.67
|
0.06
|
44
|
0
|
29487
|
21.87
|
22.81
|
| Median skyBrightness |
Yr 1 u band |
22.63
|
22.63
|
0.08
|
296
|
0
|
29487
|
21.83
|
22.80
|
| Min skyBrightness |
Yr 1 u band |
22.53
|
22.47
|
0.22
|
567
|
0
|
29487
|
21.65
|
22.80
|
| Max skyBrightness |
Yr 1 g band |
22.10
|
22.09
|
0.20
|
191
|
0
|
33183
|
18.25
|
22.36
|
| Median skyBrightness |
Yr 1 g band |
22.01
|
21.93
|
0.37
|
845
|
0
|
33183
|
18.25
|
22.35
|
| Min skyBrightness |
Yr 1 g band |
21.20
|
20.86
|
1.17
|
0
|
0
|
33183
|
17.78
|
22.34
|
| Max skyBrightness |
Yr 1 r band |
21.17
|
21.16
|
0.16
|
116
|
0
|
33246
|
18.07
|
21.39
|
| Median skyBrightness |
Yr 1 r band |
21.05
|
20.99
|
0.29
|
674
|
0
|
33246
|
18.07
|
21.36
|
| Min skyBrightness |
Yr 1 r band |
19.64
|
19.62
|
0.71
|
0
|
0
|
33246
|
17.59
|
21.33
|
| Max skyBrightness |
Yr 1 i band |
20.32
|
20.28
|
0.16
|
593
|
0
|
33311
|
18.03
|
20.47
|
| Median skyBrightness |
Yr 1 i band |
20.03
|
19.98
|
0.27
|
576
|
0
|
33311
|
18.03
|
20.45
|
| Min skyBrightness |
Yr 1 i band |
18.96
|
18.87
|
0.50
|
61
|
1
|
33311
|
17.15
|
20.41
|
| Max skyBrightness |
Yr 1 z band |
19.39
|
19.33
|
0.16
|
634
|
0
|
33255
|
17.90
|
19.52
|
| Median skyBrightness |
Yr 1 z band |
19.10
|
19.07
|
0.20
|
527
|
0
|
33255
|
17.64
|
19.49
|
| Min skyBrightness |
Yr 1 z band |
18.47
|
18.30
|
0.60
|
0
|
0
|
33255
|
16.52
|
19.44
|
| Max skyBrightness |
Yr 1 y band |
18.49
|
18.45
|
0.12
|
557
|
0
|
29670
|
17.26
|
18.61
|
| Median skyBrightness |
Yr 1 y band |
18.28
|
18.25
|
0.13
|
361
|
0
|
29670
|
17.26
|
18.59
|
| Min skyBrightness |
Yr 1 y band |
17.85
|
17.75
|
0.37
|
112
|
0
|
29670
|
16.31
|
18.49
|
|
Group: Skybrightness; Subgroup: Yr 1; Slicer: UniSlicer
|
| |
25th%ile skyBrightness |
75th%ile skyBrightness |
Count skyBrightness |
Max skyBrightness |
Mean skyBrightness |
Median skyBrightness |
Min skyBrightness |
N(+3Sigma) skyBrightness |
N(-3Sigma) skyBrightness |
Rms skyBrightness |
| Yr 1 all bands |
18.73
|
21.06
|
241913
|
22.81
|
19.93
|
19.82
|
16.31
|
0
|
0
|
1.40
|
| Yr 1 g band |
21.81
|
22.12
|
23394
|
22.36
|
21.73
|
21.99
|
17.78
|
0
|
613
|
0.75
|
| Yr 1 i band |
19.58
|
20.27
|
56225
|
20.47
|
19.87
|
20.06
|
17.15
|
0
|
770
|
0.52
|
| Yr 1 r band |
20.63
|
21.16
|
50660
|
21.39
|
20.78
|
21.04
|
17.59
|
0
|
964
|
0.62
|
| Yr 1 u band |
22.56
|
22.68
|
16822
|
22.81
|
22.60
|
22.62
|
21.65
|
0
|
451
|
0.14
|
| Yr 1 y band |
18.11
|
18.39
|
49401
|
18.61
|
18.22
|
18.27
|
16.31
|
0
|
849
|
0.25
|
| Yr 1 z band |
18.84
|
19.31
|
45411
|
19.52
|
19.01
|
19.12
|
16.52
|
0
|
990
|
0.43
|
Group: Slew; Subgroup: Slew Basics
Slew Distance Histogram
OneDSlicer
All visits
Histogram of slew distances (angle) for all visits.
Slew Time Histogram
OneDSlicer
All visits
Histogram of slew times (seconds) for all visits.
Zoom Slew Distance Histogram
OneDSlicer
All visits
Histogram of slew distances (angle) for all visits.
Zoom Slew Time Histogram
OneDSlicer
All visits
Histogram of slew times (seconds) for all visits (zoom).
|
Group: Slew; Subgroup: Slew Basics; Slicer: UniSlicer
|
| |
Max slewTime |
Mean slewTime |
Median slewTime |
Min slewTime |
Slew Count |
| All visits |
156.00
|
7.49
|
4.77
|
2.00
|
2147095
|
Group: Solarelong; Subgroup: All sky
Max solarElong
HealpixSlicer
All sky all bands
Map of Max solarElong for All sky all bands.
Max solarElong
HealpixSlicer
All sky u band
Map of Max solarElong for All sky u band.
Max solarElong
HealpixSlicer
All sky g band
Map of Max solarElong for All sky g band.
Max solarElong
HealpixSlicer
All sky r band
Map of Max solarElong for All sky r band.
Max solarElong
HealpixSlicer
All sky i band
Map of Max solarElong for All sky i band.
Max solarElong
HealpixSlicer
All sky z band
Map of Max solarElong for All sky z band.
Max solarElong
HealpixSlicer
All sky y band
Map of Max solarElong for All sky y band.
Median solarElong
HealpixSlicer
All sky all bands
Map of Median solarElong for All sky all bands.
Median solarElong
HealpixSlicer
All sky u band
Map of Median solarElong for All sky u band.
Median solarElong
HealpixSlicer
All sky g band
Map of Median solarElong for All sky g band.
Median solarElong
HealpixSlicer
All sky r band
Map of Median solarElong for All sky r band.
Median solarElong
HealpixSlicer
All sky i band
Map of Median solarElong for All sky i band.
Median solarElong
HealpixSlicer
All sky z band
Map of Median solarElong for All sky z band.
Median solarElong
HealpixSlicer
All sky y band
Map of Median solarElong for All sky y band.
Min solarElong
HealpixSlicer
All sky all bands
Map of Min solarElong for All sky all bands.
Min solarElong
HealpixSlicer
All sky u band
Map of Min solarElong for All sky u band.
Min solarElong
HealpixSlicer
All sky g band
Map of Min solarElong for All sky g band.
Min solarElong
HealpixSlicer
All sky r band
Map of Min solarElong for All sky r band.
Min solarElong
HealpixSlicer
All sky i band
Map of Min solarElong for All sky i band.
Min solarElong
HealpixSlicer
All sky z band
Map of Min solarElong for All sky z band.
Min solarElong
HealpixSlicer
All sky y band
Map of Min solarElong for All sky y band.
solarElong Histogram
OneDSlicer
All sky all bands
Histogram of solarElong for All sky all bands.
solarElong Histogram
OneDSlicer
All sky u band
Histogram of solarElong for All sky u band.
solarElong Histogram
OneDSlicer
All sky g band
Histogram of solarElong for All sky g band.
solarElong Histogram
OneDSlicer
All sky r band
Histogram of solarElong for All sky r band.
solarElong Histogram
OneDSlicer
All sky i band
Histogram of solarElong for All sky i band.
solarElong Histogram
OneDSlicer
All sky z band
Histogram of solarElong for All sky z band.
solarElong Histogram
OneDSlicer
All sky y band
Histogram of solarElong for All sky y band.
|
Group: Solarelong; Subgroup: All sky; Slicer: HealpixSlicer
|
| Metric Name |
Info Label |
Median |
Mean |
Rms |
N(-3Sigma) |
N(+3Sigma) |
Count |
Min |
Max |
| Max solarElong |
All sky all bands |
158.42
|
153.60
|
20.89
|
4
|
0
|
33578
|
66.85
|
179.95
|
| Median solarElong |
All sky all bands |
131.56
|
129.36
|
13.41
|
581
|
0
|
33578
|
66.85
|
168.77
|
| Min solarElong |
All sky all bands |
41.89
|
51.25
|
16.33
|
0
|
201
|
33578
|
34.86
|
168.77
|
| Max solarElong |
All sky u band |
154.01
|
150.11
|
20.74
|
27
|
0
|
29864
|
78.36
|
179.81
|
| Median solarElong |
All sky u band |
133.85
|
130.43
|
16.20
|
257
|
0
|
29864
|
70.77
|
174.00
|
| Min solarElong |
All sky u band |
78.45
|
80.46
|
14.09
|
0
|
333
|
29864
|
47.63
|
174.00
|
| Max solarElong |
All sky g band |
157.77
|
152.80
|
20.83
|
6
|
0
|
33481
|
84.77
|
179.91
|
| Median solarElong |
All sky g band |
135.30
|
132.07
|
15.35
|
420
|
0
|
33481
|
72.48
|
169.16
|
| Min solarElong |
All sky g band |
77.50
|
78.56
|
11.52
|
0
|
274
|
33481
|
45.53
|
169.16
|
| Max solarElong |
All sky r band |
158.15
|
153.23
|
20.95
|
16
|
0
|
33540
|
60.97
|
179.89
|
| Median solarElong |
All sky r band |
132.19
|
130.06
|
14.09
|
541
|
0
|
33540
|
60.97
|
169.17
|
| Min solarElong |
All sky r band |
62.40
|
61.18
|
17.52
|
0
|
198
|
33540
|
37.60
|
169.17
|
| Max solarElong |
All sky i band |
158.10
|
153.25
|
20.90
|
24
|
0
|
33538
|
66.84
|
179.95
|
| Median solarElong |
All sky i band |
130.61
|
128.35
|
13.15
|
582
|
4
|
33538
|
66.84
|
169.36
|
| Min solarElong |
All sky i band |
43.33
|
54.47
|
18.19
|
0
|
180
|
33538
|
35.06
|
169.36
|
| Max solarElong |
All sky z band |
157.99
|
153.12
|
20.90
|
17
|
0
|
33510
|
43.67
|
179.93
|
| Median solarElong |
All sky z band |
128.46
|
126.51
|
13.45
|
467
|
7
|
33510
|
43.66
|
169.28
|
| Min solarElong |
All sky z band |
43.37
|
54.24
|
18.22
|
0
|
195
|
33510
|
34.86
|
169.28
|
| Max solarElong |
All sky y band |
154.47
|
150.63
|
20.85
|
8
|
0
|
29952
|
70.72
|
179.87
|
| Median solarElong |
All sky y band |
131.40
|
128.52
|
13.83
|
385
|
6
|
29952
|
57.12
|
173.32
|
| Min solarElong |
All sky y band |
66.44
|
67.84
|
13.26
|
0
|
218
|
29952
|
37.37
|
172.43
|
|
Group: Solarelong; Subgroup: All sky; Slicer: UniSlicer
|
| |
25th%ile solarElong |
75th%ile solarElong |
Count solarElong |
Max solarElong |
Mean solarElong |
Median solarElong |
Min solarElong |
N(+3Sigma) solarElong |
N(-3Sigma) solarElong |
Rms solarElong |
| All sky all bands |
105.12
|
145.13
|
2147095
|
179.95
|
123.46
|
126.49
|
34.86
|
0
|
383
|
28.95
|
| All sky g band |
108.58
|
147.15
|
196987
|
179.91
|
127.31
|
129.37
|
45.53
|
0
|
100
|
25.36
|
| All sky i band |
104.60
|
144.51
|
500895
|
179.95
|
122.26
|
125.75
|
35.06
|
0
|
0
|
30.41
|
| All sky r band |
106.16
|
145.43
|
489465
|
179.89
|
123.95
|
127.23
|
37.60
|
0
|
0
|
28.94
|
| All sky u band |
107.37
|
146.52
|
124477
|
179.81
|
126.43
|
128.75
|
47.63
|
0
|
24
|
25.73
|
| All sky y band |
105.33
|
144.81
|
394073
|
179.87
|
124.47
|
126.38
|
37.37
|
0
|
74
|
26.24
|
| All sky z band |
102.06
|
144.22
|
441198
|
179.93
|
120.80
|
124.53
|
34.86
|
0
|
0
|
31.47
|
Group: Solarelong; Subgroup: WFD
Max solarElong
HealpixSubsetSlicer
WFD all bands
Map of Max solarElong for WFD all bands.
Max solarElong
HealpixSubsetSlicer
WFD u band
Map of Max solarElong for WFD u band.
Max solarElong
HealpixSubsetSlicer
WFD g band
Map of Max solarElong for WFD g band.
Max solarElong
HealpixSubsetSlicer
WFD r band
Map of Max solarElong for WFD r band.
Max solarElong
HealpixSubsetSlicer
WFD i band
Map of Max solarElong for WFD i band.
Max solarElong
HealpixSubsetSlicer
WFD z band
Map of Max solarElong for WFD z band.
Max solarElong
HealpixSubsetSlicer
WFD y band
Map of Max solarElong for WFD y band.
Median solarElong
HealpixSubsetSlicer
WFD all bands
Map of Median solarElong for WFD all bands.
Median solarElong
HealpixSubsetSlicer
WFD u band
Map of Median solarElong for WFD u band.
Median solarElong
HealpixSubsetSlicer
WFD g band
Map of Median solarElong for WFD g band.
Median solarElong
HealpixSubsetSlicer
WFD r band
Map of Median solarElong for WFD r band.
Median solarElong
HealpixSubsetSlicer
WFD i band
Map of Median solarElong for WFD i band.
Median solarElong
HealpixSubsetSlicer
WFD z band
Map of Median solarElong for WFD z band.
Median solarElong
HealpixSubsetSlicer
WFD y band
Map of Median solarElong for WFD y band.
Min solarElong
HealpixSubsetSlicer
WFD all bands
Map of Min solarElong for WFD all bands.
Min solarElong
HealpixSubsetSlicer
WFD u band
Map of Min solarElong for WFD u band.
Min solarElong
HealpixSubsetSlicer
WFD g band
Map of Min solarElong for WFD g band.
Min solarElong
HealpixSubsetSlicer
WFD r band
Map of Min solarElong for WFD r band.
Min solarElong
HealpixSubsetSlicer
WFD i band
Map of Min solarElong for WFD i band.
Min solarElong
HealpixSubsetSlicer
WFD z band
Map of Min solarElong for WFD z band.
Min solarElong
HealpixSubsetSlicer
WFD y band
Map of Min solarElong for WFD y band.
solarElong Histogram
OneDSlicer
WFD all bands
Histogram of solarElong for WFD all bands.
solarElong Histogram
OneDSlicer
WFD u band
Histogram of solarElong for WFD u band.
solarElong Histogram
OneDSlicer
WFD g band
Histogram of solarElong for WFD g band.
solarElong Histogram
OneDSlicer
WFD r band
Histogram of solarElong for WFD r band.
solarElong Histogram
OneDSlicer
WFD i band
Histogram of solarElong for WFD i band.
solarElong Histogram
OneDSlicer
WFD z band
Histogram of solarElong for WFD z band.
solarElong Histogram
OneDSlicer
WFD y band
Histogram of solarElong for WFD y band.
|
Group: Solarelong; Subgroup: WFD; Slicer: HealpixSubsetSlicer
|
| Metric Name |
Info Label |
Median |
Mean |
Rms |
N(-3Sigma) |
N(+3Sigma) |
Count |
Min |
Max |
| Max solarElong |
WFD all bands |
156.73
|
152.92
|
20.35
|
0
|
0
|
22469
|
92.10
|
179.95
|
| Median solarElong |
WFD all bands |
131.92
|
129.72
|
12.59
|
344
|
0
|
22469
|
81.39
|
154.21
|
| Min solarElong |
WFD all bands |
40.66
|
47.18
|
12.68
|
0
|
88
|
22469
|
34.86
|
88.49
|
| Max solarElong |
WFD u band |
156.01
|
152.05
|
20.14
|
16
|
0
|
22469
|
89.90
|
179.81
|
| Median solarElong |
WFD u band |
134.97
|
131.41
|
15.05
|
214
|
0
|
22469
|
76.53
|
165.68
|
| Min solarElong |
WFD u band |
76.04
|
76.37
|
9.94
|
0
|
51
|
22469
|
47.63
|
118.84
|
| Max solarElong |
WFD g band |
156.18
|
152.28
|
20.18
|
3
|
0
|
22469
|
90.85
|
179.91
|
| Median solarElong |
WFD g band |
135.80
|
132.49
|
14.18
|
253
|
0
|
22469
|
80.24
|
158.76
|
| Min solarElong |
WFD g band |
75.18
|
75.54
|
9.05
|
17
|
54
|
22469
|
45.53
|
110.22
|
| Max solarElong |
WFD r band |
156.54
|
152.67
|
20.30
|
3
|
0
|
22469
|
91.50
|
179.89
|
| Median solarElong |
WFD r band |
132.58
|
130.30
|
12.76
|
328
|
0
|
22469
|
79.06
|
154.49
|
| Min solarElong |
WFD r band |
59.01
|
57.43
|
14.08
|
0
|
0
|
22469
|
37.60
|
98.15
|
| Max solarElong |
WFD i band |
156.56
|
152.68
|
20.32
|
0
|
0
|
22469
|
91.83
|
179.95
|
| Median solarElong |
WFD i band |
131.00
|
128.87
|
12.14
|
337
|
0
|
22469
|
81.76
|
155.85
|
| Min solarElong |
WFD i band |
42.02
|
49.96
|
14.71
|
0
|
4
|
22469
|
35.06
|
98.45
|
| Max solarElong |
WFD z band |
156.47
|
152.63
|
20.31
|
1
|
0
|
22469
|
91.64
|
179.93
|
| Median solarElong |
WFD z band |
129.56
|
127.65
|
12.17
|
301
|
0
|
22469
|
80.50
|
154.23
|
| Min solarElong |
WFD z band |
41.98
|
49.43
|
14.10
|
0
|
10
|
22469
|
34.86
|
92.93
|
| Max solarElong |
WFD y band |
156.39
|
152.51
|
20.27
|
1
|
0
|
22469
|
91.50
|
179.87
|
| Median solarElong |
WFD y band |
132.73
|
129.79
|
13.11
|
303
|
0
|
22469
|
80.97
|
155.19
|
| Min solarElong |
WFD y band |
64.42
|
64.55
|
10.25
|
0
|
72
|
22469
|
37.37
|
100.39
|
|
Group: Solarelong; Subgroup: WFD; Slicer: UniSlicer
|
| |
25th%ile solarElong |
75th%ile solarElong |
Count solarElong |
Max solarElong |
Mean solarElong |
Median solarElong |
Min solarElong |
N(+3Sigma) solarElong |
N(-3Sigma) solarElong |
Rms solarElong |
| WFD all bands |
105.12
|
145.13
|
2147095
|
179.95
|
123.46
|
126.49
|
34.86
|
0
|
383
|
28.95
|
| WFD g band |
108.58
|
147.15
|
196987
|
179.91
|
127.31
|
129.37
|
45.53
|
0
|
100
|
25.36
|
| WFD i band |
104.60
|
144.51
|
500895
|
179.95
|
122.26
|
125.75
|
35.06
|
0
|
0
|
30.41
|
| WFD r band |
106.16
|
145.43
|
489465
|
179.89
|
123.95
|
127.23
|
37.60
|
0
|
0
|
28.94
|
| WFD u band |
107.37
|
146.52
|
124477
|
179.81
|
126.43
|
128.75
|
47.63
|
0
|
24
|
25.73
|
| WFD y band |
105.33
|
144.81
|
394073
|
179.87
|
124.47
|
126.38
|
37.37
|
0
|
74
|
26.24
|
| WFD z band |
102.06
|
144.22
|
441198
|
179.93
|
120.80
|
124.53
|
34.86
|
0
|
0
|
31.47
|
Group: T_eff Maps; Subgroup: All sky
Normalized Teff
HealpixSlicer
All sky all bands
Normalized effective time of the survey, for All sky all bands
Normalized Teff
HealpixSlicer
All sky u band
Normalized effective time of the survey, for All sky u band
Normalized Teff
HealpixSlicer
All sky g band
Normalized effective time of the survey, for All sky g band
Normalized Teff
HealpixSlicer
All sky r band
Normalized effective time of the survey, for All sky r band
Normalized Teff
HealpixSlicer
All sky i band
Normalized effective time of the survey, for All sky i band
Normalized Teff
HealpixSlicer
All sky z band
Normalized effective time of the survey, for All sky z band
Normalized Teff
HealpixSlicer
All sky y band
Normalized effective time of the survey, for All sky y band
|
Group: T_eff Maps; Subgroup: All sky; Slicer: HealpixSlicer
|
| Metric Name |
Info Label |
Median |
Mean |
Rms |
N(-3Sigma) |
N(+3Sigma) |
Count |
Min |
Max |
| Normalized Teff |
All sky all bands |
0.67
|
0.65
|
0.18
|
7
|
1
|
33578
|
0.03
|
1.37
|
| Normalized Teff |
All sky u band |
0.42
|
0.42
|
0.11
|
8
|
131
|
29864
|
0.0249
|
1.13
|
| Normalized Teff |
All sky g band |
0.75
|
0.74
|
0.24
|
2
|
14
|
33481
|
0.0159
|
1.53
|
| Normalized Teff |
All sky r band |
0.80
|
0.79
|
0.23
|
4
|
1
|
33540
|
0.04
|
1.48
|
| Normalized Teff |
All sky i band |
0.69
|
0.66
|
0.19
|
9
|
2
|
33538
|
0.05
|
1.26
|
| Normalized Teff |
All sky z band |
0.67
|
0.65
|
0.18
|
12
|
2
|
33510
|
0.0167
|
1.48
|
| Normalized Teff |
All sky y band |
0.55
|
0.53
|
0.12
|
76
|
0
|
29952
|
0.04
|
0.85
|
Group: T_eff Maps; Subgroup: WFD
Normalized Teff
HealpixSubsetSlicer
WFD all bands
Normalized effective time of the survey, for WFD all bands
Normalized Teff
HealpixSubsetSlicer
WFD u band
Normalized effective time of the survey, for WFD u band
Normalized Teff
HealpixSubsetSlicer
WFD g band
Normalized effective time of the survey, for WFD g band
Normalized Teff
HealpixSubsetSlicer
WFD r band
Normalized effective time of the survey, for WFD r band
Normalized Teff
HealpixSubsetSlicer
WFD i band
Normalized effective time of the survey, for WFD i band
Normalized Teff
HealpixSubsetSlicer
WFD z band
Normalized effective time of the survey, for WFD z band
Normalized Teff
HealpixSubsetSlicer
WFD y band
Normalized effective time of the survey, for WFD y band
|
Group: T_eff Maps; Subgroup: WFD; Slicer: HealpixSubsetSlicer
|
| Metric Name |
Info Label |
Median |
Mean |
Rms |
N(-3Sigma) |
N(+3Sigma) |
Count |
Min |
Max |
| Normalized Teff |
WFD all bands |
0.71
|
0.71
|
0.13
|
0
|
0
|
22469
|
0.34
|
1.08
|
| Normalized Teff |
WFD u band |
0.42
|
0.42
|
0.09
|
0
|
15
|
22469
|
0.18
|
0.73
|
| Normalized Teff |
WFD g band |
0.79
|
0.80
|
0.17
|
0
|
2
|
22469
|
0.35
|
1.31
|
| Normalized Teff |
WFD r band |
0.85
|
0.86
|
0.17
|
0
|
0
|
22469
|
0.42
|
1.33
|
| Normalized Teff |
WFD i band |
0.73
|
0.73
|
0.14
|
0
|
3
|
22469
|
0.35
|
1.19
|
| Normalized Teff |
WFD z band |
0.71
|
0.71
|
0.13
|
0
|
4
|
22469
|
0.36
|
1.23
|
| Normalized Teff |
WFD y band |
0.56
|
0.55
|
0.10
|
10
|
0
|
22469
|
0.23
|
0.84
|
Group: T_eff Summary; Subgroup: All sky
|
Group: T_eff Summary; Subgroup: All sky; Slicer: UniSlicer
|
| |
Normalized Teff |
Total Teff |
| All sky all bands |
0.70
|
45070723.50
|
Group: T_eff Summary; Subgroup: WFD
|
Group: T_eff Summary; Subgroup: WFD; Slicer: UniSlicer
|
| |
Normalized Teff |
Total Teff |
| WFD all bands |
0.70
|
45070723.50
|