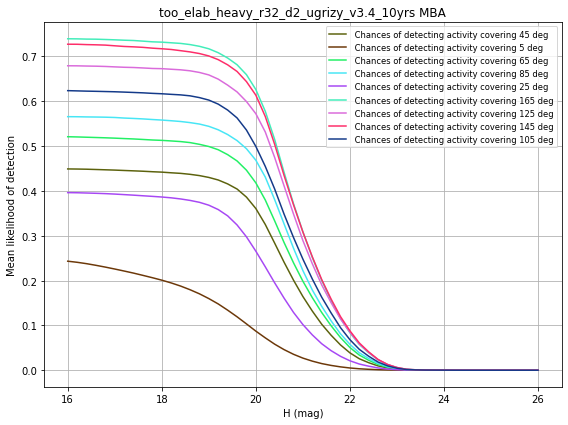
Group: MBA; Subgroup: Activity
Group: MBA; Subgroup: Characterization Fraction
|
ColorAsteroid calculated on a MoObjSlicer basis.
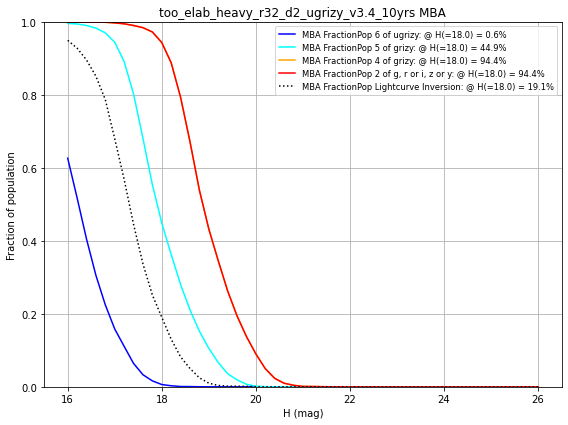
Group: MBA; Subgroup: Color/Inversion
| Group: MBA; Subgroup: Color/Inversion; Slicer: MoObjSlicer | |||||
| FractionPop 2 of g, r or i, z or y | FractionPop 4 of grizy | FractionPop 5 of grizy | FractionPop 6 of ugrizy | FractionPop Lightcurve Inversion | |
|---|---|---|---|---|---|
| MBA | 0.94 | 0.94 | 0.45 | 0.0062 | 0.19 |
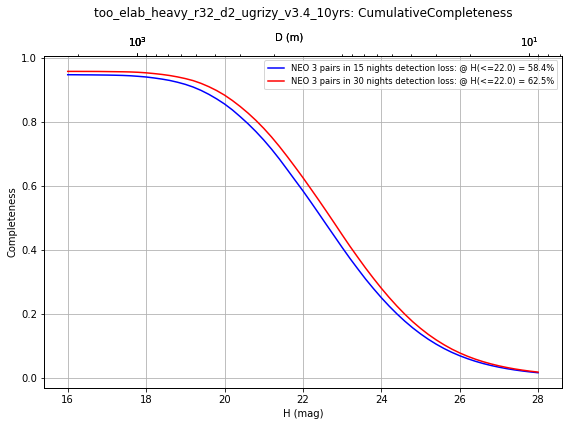
Group: MBA; Subgroup: Completeness
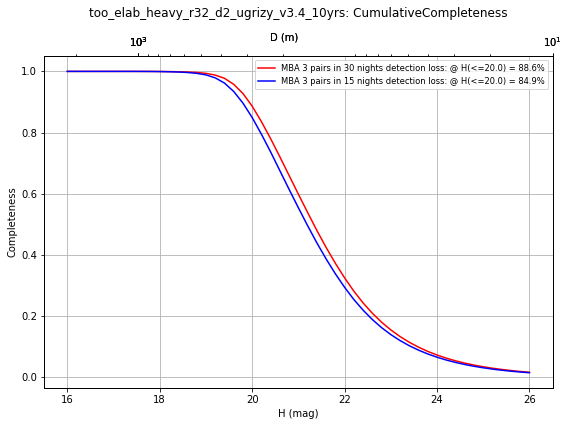
|
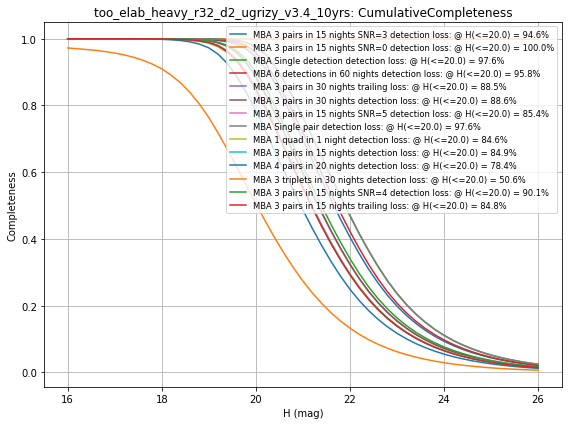
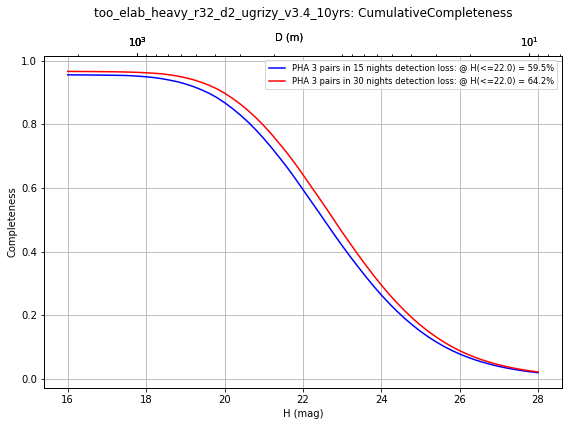
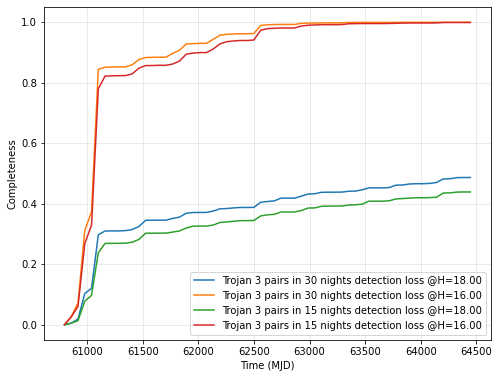
CumulativeCompleteness metric(s) calculated on a MoObjSlicer grid, for opsim runs too_elab_heavy_r32_d2_ugrizy_v3.4_10yrs, for info_label values of 30, 15 loss nights 3 in detection pairs MBA .
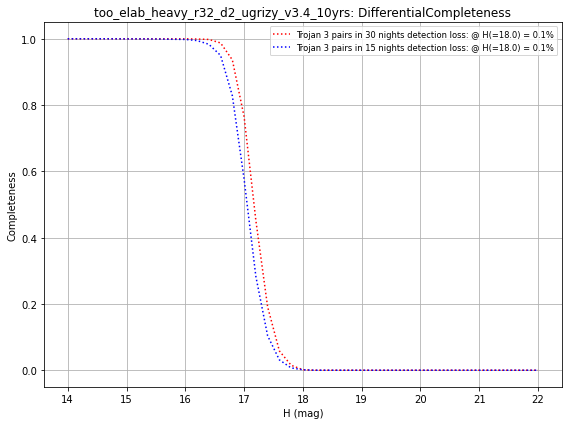
DifferentialCompleteness MoObjSlicer 30, 15 loss nights 3 in detection pairs MBA
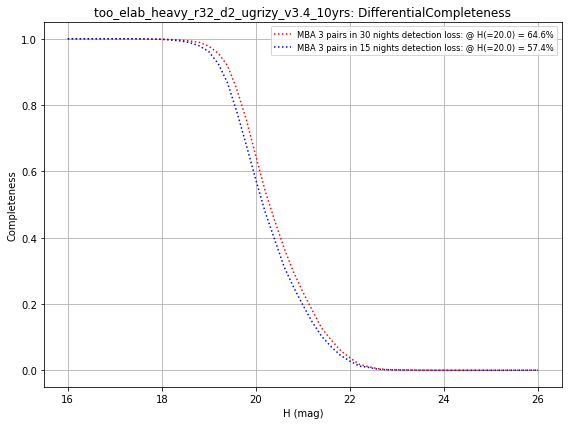
|
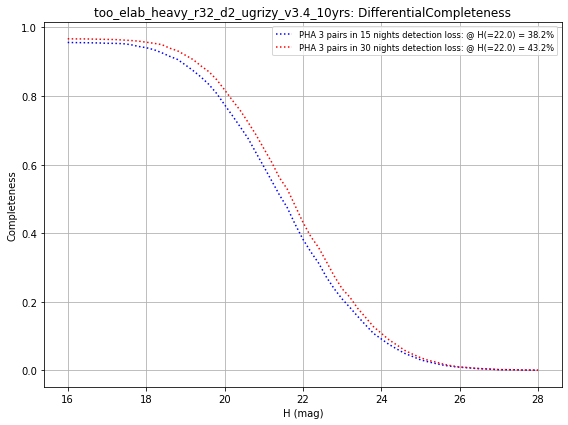
DifferentialCompleteness metric(s) calculated on a MoObjSlicer grid, for opsim runs too_elab_heavy_r32_d2_ugrizy_v3.4_10yrs, for info_label values of 30, 15 loss nights 3 in detection pairs MBA .
| Group: MBA; Subgroup: Completeness; Slicer: MoObjSlicer | ||
| CumulativeCompleteness | DifferentialCompleteness | |
|---|---|---|
| MBA 1 quad in 1 night detection loss | 0.85 | 0.58 |
| MBA 3 pairs in 15 nights SNR=0 detection loss | 1.00 | 1.00 |
| MBA 3 pairs in 15 nights SNR=3 detection loss | 0.95 | 0.81 |
| MBA 3 pairs in 15 nights SNR=4 detection loss | 0.90 | 0.69 |
| MBA 3 pairs in 15 nights SNR=5 detection loss | 0.85 | 0.58 |
| MBA 3 pairs in 15 nights detection loss | 0.85 | 0.57 |
| MBA 3 pairs in 15 nights trailing loss | 0.85 | 0.57 |
| MBA 3 pairs in 30 nights detection loss | 0.89 | 0.65 |
| MBA 3 pairs in 30 nights trailing loss | 0.88 | 0.64 |
| MBA 3 triplets in 30 nights detection loss | 0.51 | 0.19 |
| MBA 4 pairs in 20 nights detection loss | 0.78 | 0.47 |
| MBA 6 detections in 60 nights detection loss | 0.96 | 0.84 |
| MBA High velocity pair detection loss | 0.0000 | 0.0000 |
| MBA Single detection detection loss | 0.98 | 0.90 |
| MBA Single pair detection loss | 0.98 | 0.90 |
Group: MBA; Subgroup: Completeness Over Time
|
Time of discovery of objects
Chances of detecting activity lasting X days MoObjSlicer MBA
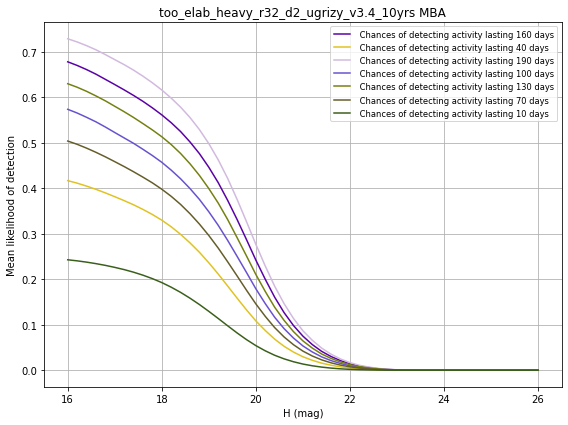
|
Time of discovery of objects
Group: MBA; Subgroup: Completeness all criteria
|
Plotting all of the cumulative completeness curves together.
Group: MBA; Subgroup: Completeness over time
|
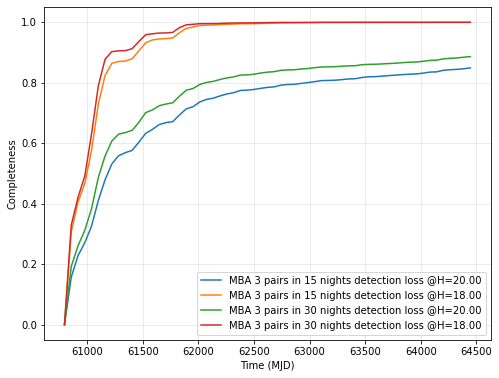
Completeness over time, for H values indicated in legend.
Group: MBA; Subgroup: Discovery

|
HighVelocityNights calculated on a MoObjSlicer basis.
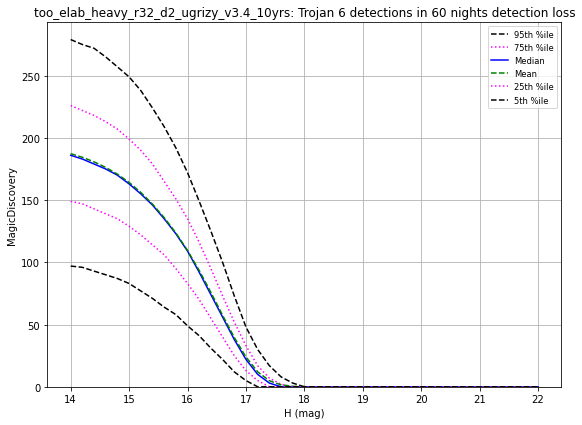
MagicDiscovery MoObjSlicer MBA 6 detections in 60 nights detection loss
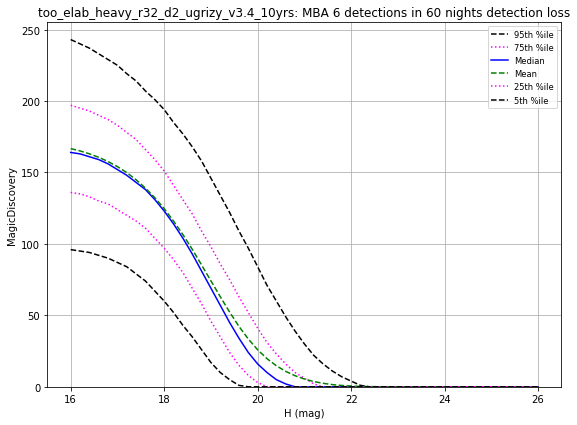
|
MagicDiscovery calculated on a MoObjSlicer basis.
Group: MBA; Subgroup: N Chances
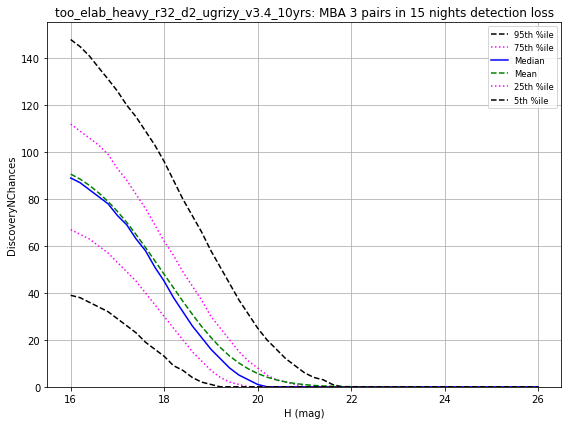
|
Number of chances for discovery of objects
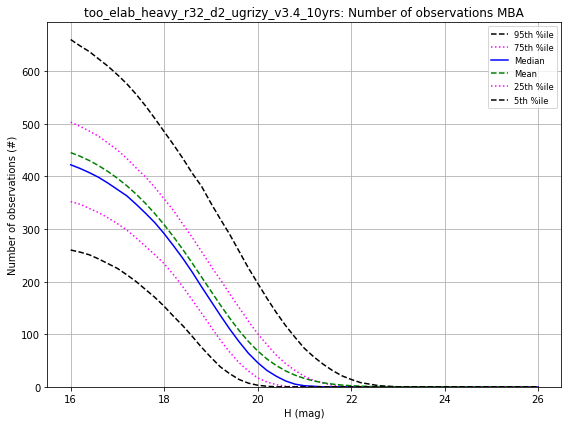
|
NObs calculated on a MoObjSlicer basis.
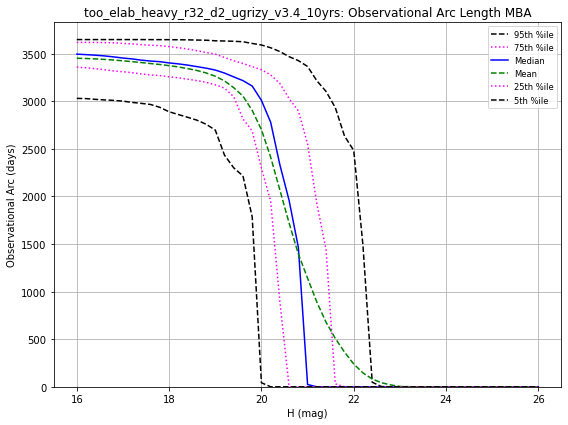
|
ObsArc calculated on a MoObjSlicer basis.
Group: NEO; Subgroup: Activity
Group: NEO; Subgroup: Characterization Fraction

|
LightcurveInversionAsteroid calculated on a MoObjSlicer basis.
Group: NEO; Subgroup: Color/Inversion
| Group: NEO; Subgroup: Color/Inversion; Slicer: MoObjSlicer | |||||
| FractionPop 2 of g, r or i, z or y | FractionPop 4 of grizy | FractionPop 5 of grizy | FractionPop 6 of ugrizy | FractionPop Lightcurve Inversion | |
|---|---|---|---|---|---|
| NEO | 0.32 | 0.32 | 0.15 | 0.0062 | 0.0170 |
Group: NEO; Subgroup: Completeness
|
CumulativeCompleteness metric(s) calculated on a MoObjSlicer grid, for opsim runs too_elab_heavy_r32_d2_ugrizy_v3.4_10yrs, for info_label values of 30, 15 detection nights pairs NEO in loss 3 .
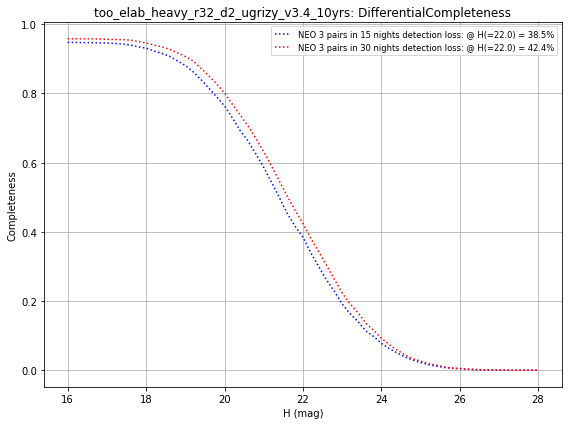
DifferentialCompleteness MoObjSlicer 30, 15 detection nights pairs NEO in loss 3
|
DifferentialCompleteness metric(s) calculated on a MoObjSlicer grid, for opsim runs too_elab_heavy_r32_d2_ugrizy_v3.4_10yrs, for info_label values of 30, 15 detection nights pairs NEO in loss 3 .
| Group: NEO; Subgroup: Completeness; Slicer: MoObjSlicer | ||||
| Metric Name | Info Label | Nobj <= 22.0 | Nobj <= 25.0 | Value At H=22.0 |
|---|---|---|---|---|
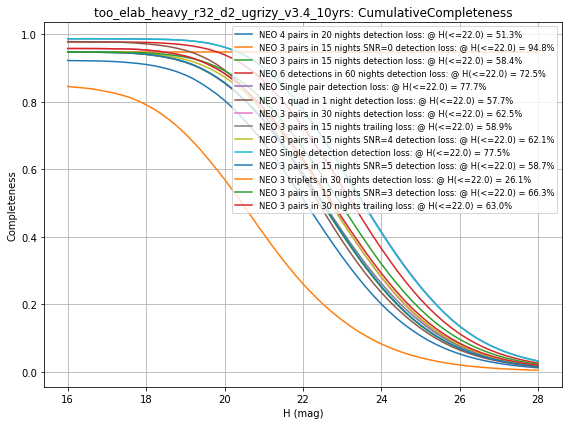
| CumulativeCompleteness | NEO 1 quad in 1 night detection loss | -- | -- | 0.58 |
| DifferentialCompleteness | NEO 1 quad in 1 night detection loss | 15755.97 | 56958.16 | 0.34 |
| CumulativeCompleteness | NEO 3 pairs in 15 nights SNR=0 detection loss | -- | -- | 0.95 |
| DifferentialCompleteness | NEO 3 pairs in 15 nights SNR=0 detection loss | 25473.81 | 817851.83 | 0.95 |
| CumulativeCompleteness | NEO 3 pairs in 15 nights SNR=3 detection loss | -- | -- | 0.66 |
| DifferentialCompleteness | NEO 3 pairs in 15 nights SNR=3 detection loss | 17993.88 | 90187.89 | 0.47 |
| CumulativeCompleteness | NEO 3 pairs in 15 nights SNR=4 detection loss | -- | -- | 0.62 |
| DifferentialCompleteness | NEO 3 pairs in 15 nights SNR=4 detection loss | 16871.60 | 72583.21 | 0.42 |
| CumulativeCompleteness | NEO 3 pairs in 15 nights SNR=5 detection loss | -- | -- | 0.59 |
| DifferentialCompleteness | NEO 3 pairs in 15 nights SNR=5 detection loss | 15971.19 | 61156.78 | 0.38 |
| CumulativeCompleteness | NEO 3 pairs in 15 nights detection loss | -- | -- | 0.58 |
| DifferentialCompleteness | NEO 3 pairs in 15 nights detection loss | 15906.94 | 60336.12 | 0.38 |
| CumulativeCompleteness | NEO 3 pairs in 15 nights trailing loss | -- | -- | 0.59 |
| DifferentialCompleteness | NEO 3 pairs in 15 nights trailing loss | 16031.23 | 69094.39 | 0.39 |
| CumulativeCompleteness | NEO 3 pairs in 30 nights detection loss | -- | -- | 0.63 |
| DifferentialCompleteness | NEO 3 pairs in 30 nights detection loss | 17002.01 | 68951.79 | 0.42 |
| CumulativeCompleteness | NEO 3 pairs in 30 nights trailing loss | -- | -- | 0.63 |
| DifferentialCompleteness | NEO 3 pairs in 30 nights trailing loss | 17118.65 | 78536.58 | 0.43 |
| CumulativeCompleteness | NEO 3 triplets in 30 nights detection loss | -- | -- | 0.26 |
| DifferentialCompleteness | NEO 3 triplets in 30 nights detection loss | 7270.86 | 15261.27 | 0.10 |
| CumulativeCompleteness | NEO 4 pairs in 20 nights detection loss | -- | -- | 0.51 |
| DifferentialCompleteness | NEO 4 pairs in 20 nights detection loss | 14001.76 | 43892.87 | 0.30 |
| CumulativeCompleteness | NEO 6 detections in 60 nights detection loss | -- | -- | 0.73 |
| DifferentialCompleteness | NEO 6 detections in 60 nights detection loss | 19645.91 | 108129.16 | 0.54 |
| CumulativeCompleteness | NEO High velocity pair detection loss | -- | -- | 0.28 |
| DifferentialCompleteness | NEO High velocity pair detection loss | 7421.03 | 69153.51 | 0.24 |
| CumulativeCompleteness | NEO Single detection detection loss | -- | -- | 0.78 |
| DifferentialCompleteness | NEO Single detection detection loss | 20964.85 | 132662.18 | 0.60 |
| CumulativeCompleteness | NEO Single pair detection loss | -- | -- | 0.78 |
| DifferentialCompleteness | NEO Single pair detection loss | 21005.20 | 134460.85 | 0.60 |
Group: NEO; Subgroup: Completeness Over Time
|
Time of discovery of objects
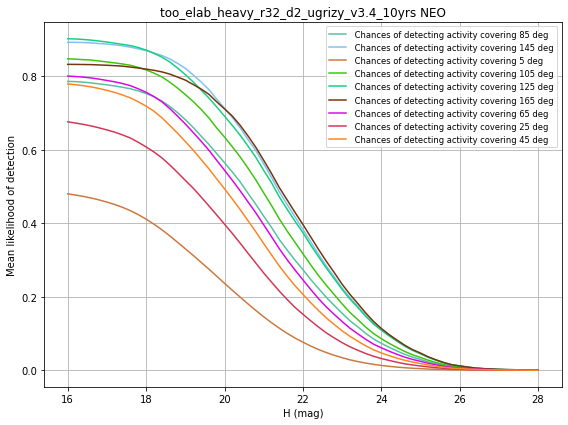
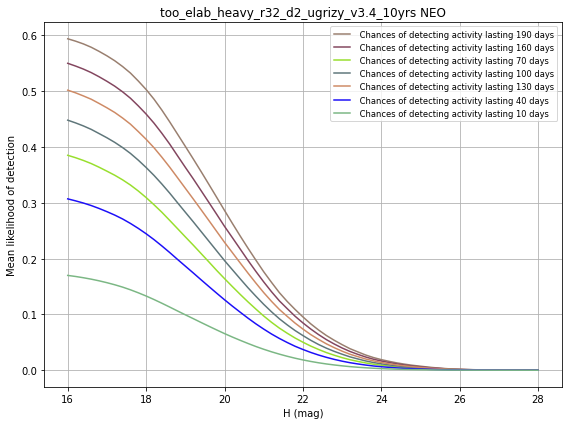
Chances of detecting activity lasting X days MoObjSlicer NEO
|
Time of discovery of objects
Group: NEO; Subgroup: Completeness all criteria
|
Plotting all of the cumulative completeness curves together.
Group: NEO; Subgroup: Completeness over time
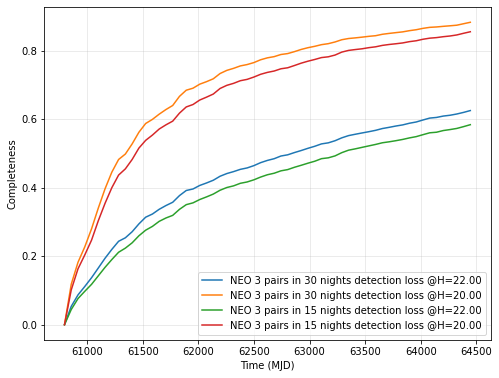
|
Completeness over time, for H values indicated in legend.
Group: NEO; Subgroup: Discovery
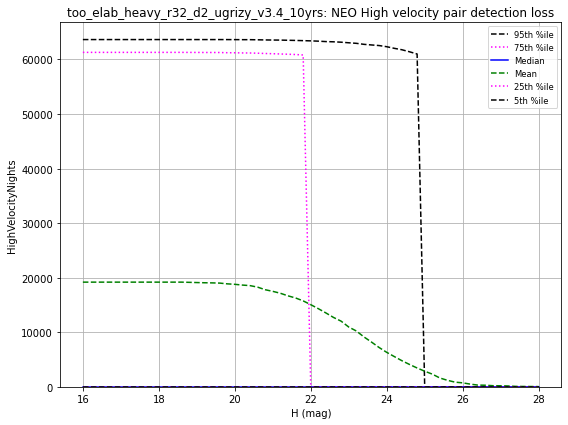
|
HighVelocityNights calculated on a MoObjSlicer basis.
MagicDiscovery MoObjSlicer NEO 6 detections in 60 nights detection loss
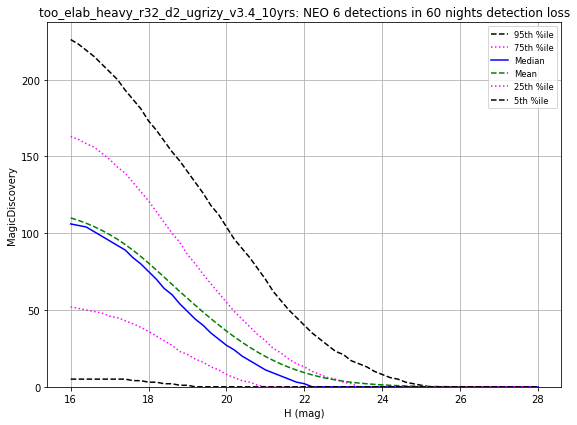
|
MagicDiscovery calculated on a MoObjSlicer basis.
Group: NEO; Subgroup: N Chances
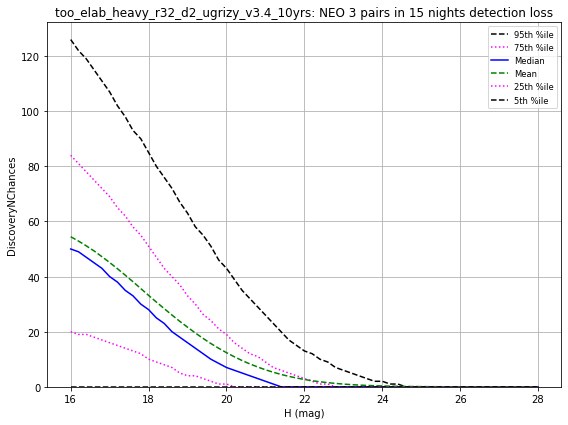
|
Number of chances for discovery of objects

|
NObs calculated on a MoObjSlicer basis.
|
ObsArc calculated on a MoObjSlicer basis.
Group: OCC_r20; Subgroup: Activity
Group: OCC_r20; Subgroup: Characterization Fraction
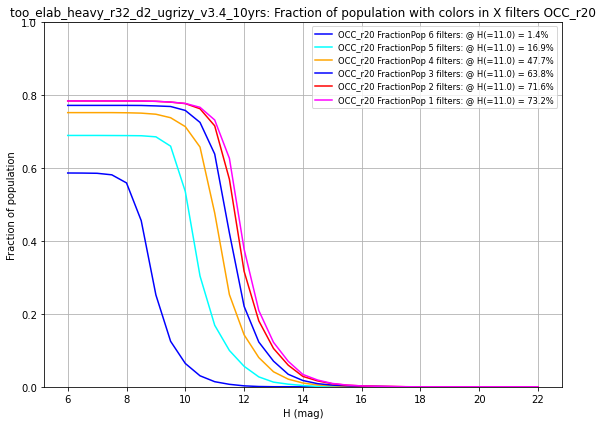
|
LightcurveColorOuter calculated on a MoObjSlicer basis.
Group: OCC_r20; Subgroup: Color/Inversion
| Group: OCC_r20; Subgroup: Color/Inversion; Slicer: MoObjSlicer | ||||||
| FractionPop 1 filters | FractionPop 2 filters | FractionPop 3 filters | FractionPop 4 filters | FractionPop 5 filters | FractionPop 6 filters | |
|---|---|---|---|---|---|---|
| OCC_r20 | 0.73 | 0.72 | 0.64 | 0.48 | 0.17 | 0.0140 |
Group: OCC_r20; Subgroup: Completeness
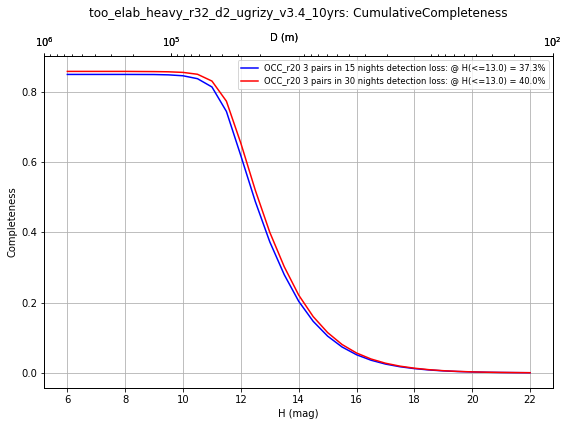
|
CumulativeCompleteness metric(s) calculated on a MoObjSlicer grid, for opsim runs too_elab_heavy_r32_d2_ugrizy_v3.4_10yrs, for info_label values of 30, 15 loss nights pairs detection OCC_r20 3 in .
DifferentialCompleteness MoObjSlicer 30, 15 loss nights pairs detection OCC_r20 3 in
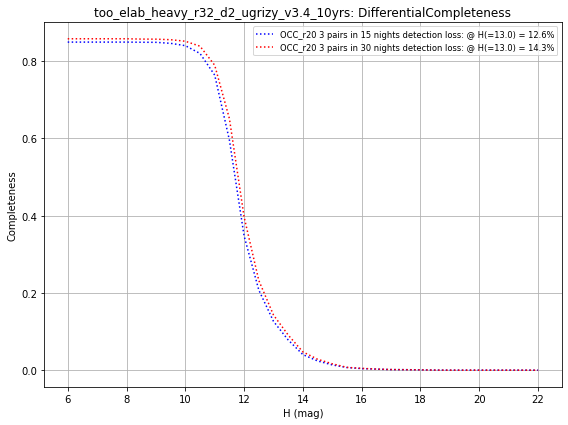
|
DifferentialCompleteness metric(s) calculated on a MoObjSlicer grid, for opsim runs too_elab_heavy_r32_d2_ugrizy_v3.4_10yrs, for info_label values of 30, 15 loss nights pairs detection OCC_r20 3 in .
| Group: OCC_r20; Subgroup: Completeness; Slicer: MoObjSlicer | ||
| CumulativeCompleteness | DifferentialCompleteness | |
|---|---|---|
| OCC_r20 1 quad in 1 night detection loss | 0.39 | 0.14 |
| OCC_r20 3 pairs in 15 nights SNR=0 detection loss | 0.85 | 0.85 |
| OCC_r20 3 pairs in 15 nights SNR=3 detection loss | 0.48 | 0.20 |
| OCC_r20 3 pairs in 15 nights SNR=4 detection loss | 0.42 | 0.16 |
| OCC_r20 3 pairs in 15 nights SNR=5 detection loss | 0.37 | 0.13 |
| OCC_r20 3 pairs in 15 nights detection loss | 0.37 | 0.13 |
| OCC_r20 3 pairs in 15 nights trailing loss | 0.37 | 0.13 |
| OCC_r20 3 pairs in 30 nights detection loss | 0.40 | 0.14 |
| OCC_r20 3 pairs in 30 nights trailing loss | 0.40 | 0.14 |
| OCC_r20 3 triplets in 30 nights detection loss | 0.23 | 0.06 |
| OCC_r20 4 pairs in 20 nights detection loss | 0.33 | 0.11 |
| OCC_r20 6 detections in 60 nights detection loss | 0.47 | 0.20 |
| OCC_r20 High velocity pair detection loss | 0.0002 | 0.0002 |
| OCC_r20 Single detection detection loss | 0.50 | 0.22 |
| OCC_r20 Single pair detection loss | 0.50 | 0.22 |
Group: OCC_r20; Subgroup: Completeness Over Time
Group: OCC_r20; Subgroup: Completeness all criteria
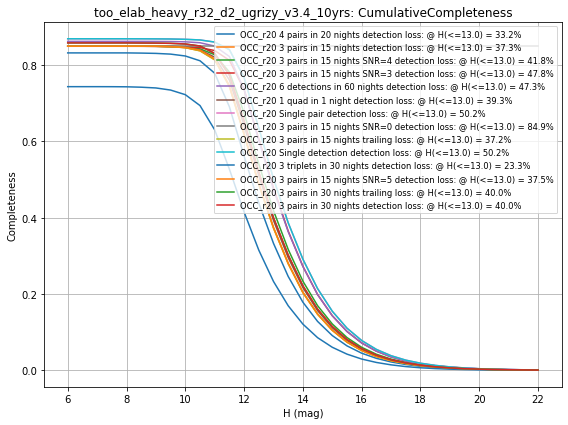
|
Plotting all of the cumulative completeness curves together.
Group: OCC_r20; Subgroup: Completeness over time
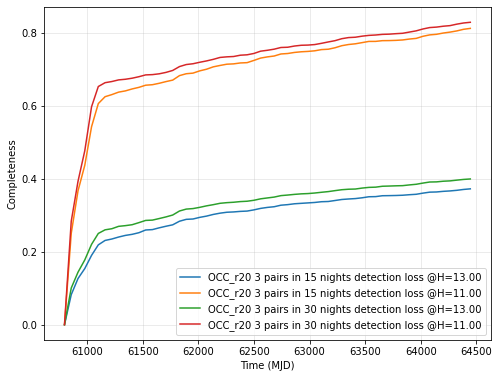
|
Completeness over time, for H values indicated in legend.
Group: OCC_r20; Subgroup: Discovery
|
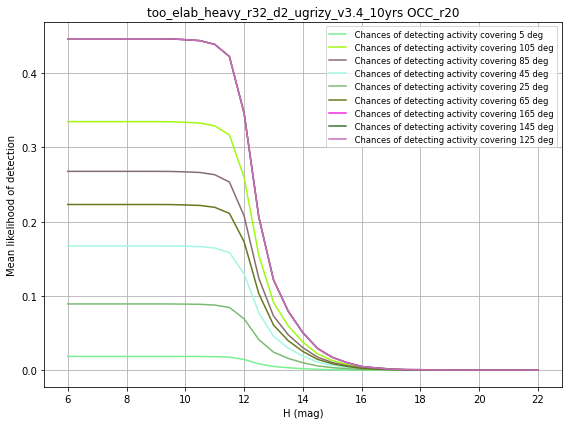
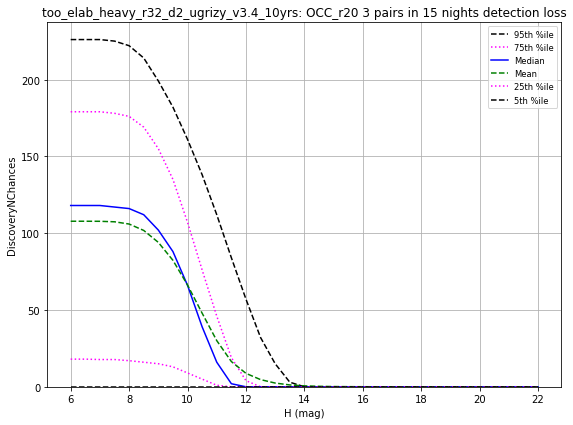
Discovery_2x3in15 calculated on a MoObjSlicer basis.
Chances of detecting activity lasting X days MoObjSlicer OCC_r20
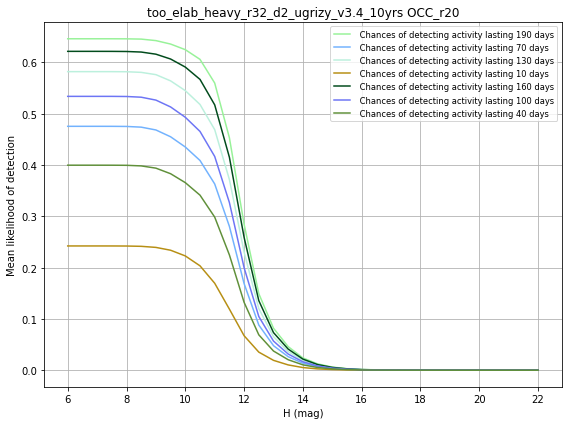
|
Discovery_2x3in15 calculated on a MoObjSlicer basis.
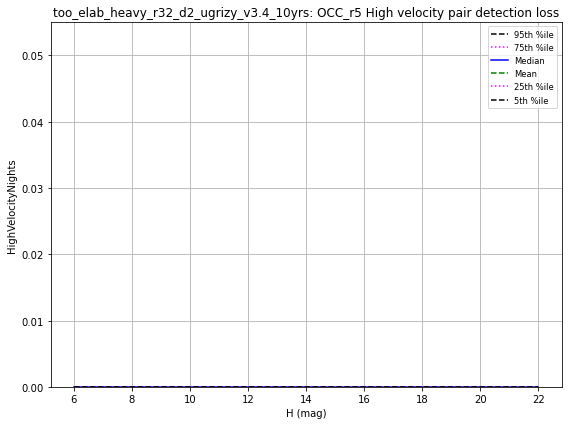
HighVelocityNights MoObjSlicer OCC_r20 High velocity pair detection loss
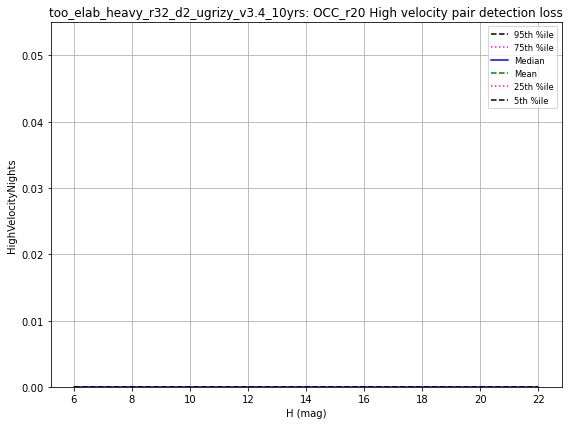
|
HighVelocityNights calculated on a MoObjSlicer basis.
MagicDiscovery MoObjSlicer OCC_r20 6 detections in 60 nights detection loss
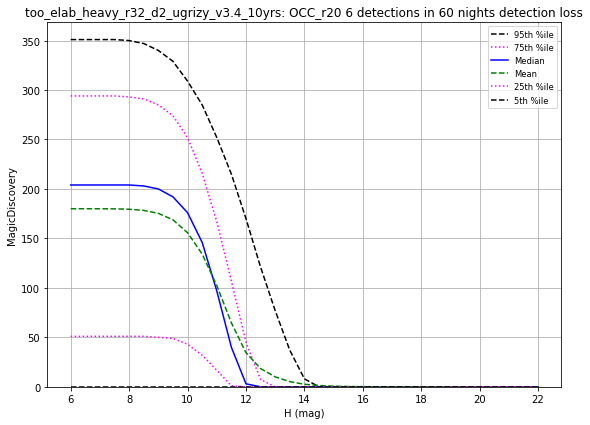
|
MagicDiscovery calculated on a MoObjSlicer basis.
Group: OCC_r20; Subgroup: N Chances
|
Number of chances for discovery of objects
Group: OCC_r20; Subgroup: N Obs
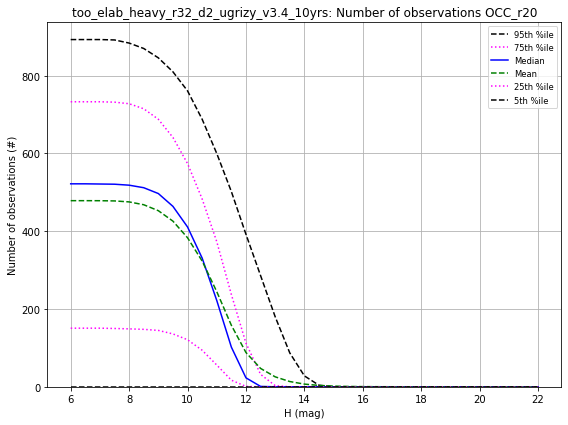
|
NObs calculated on a MoObjSlicer basis.
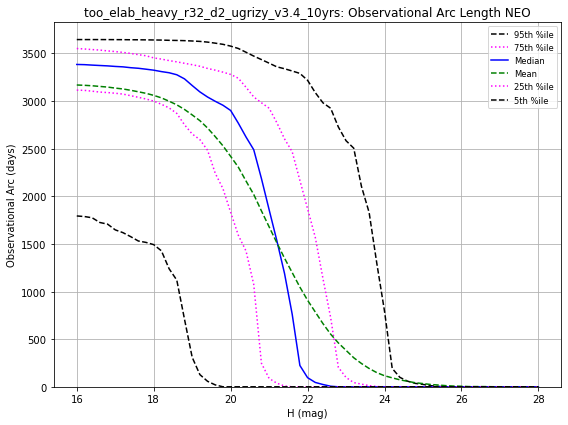
Group: OCC_r20; Subgroup: Obs Arc
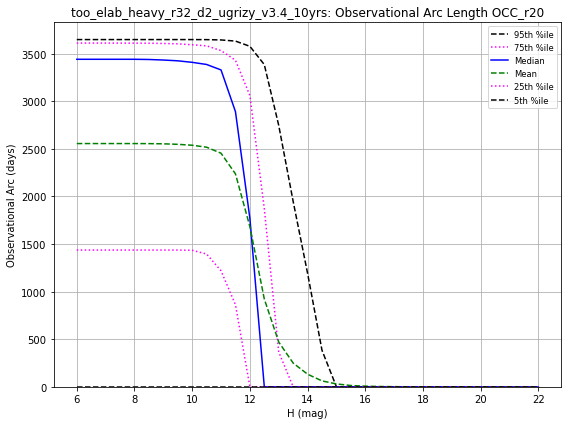
|
ObsArc calculated on a MoObjSlicer basis.
Group: OCC_r5; Subgroup: Activity
Group: OCC_r5; Subgroup: Characterization Fraction
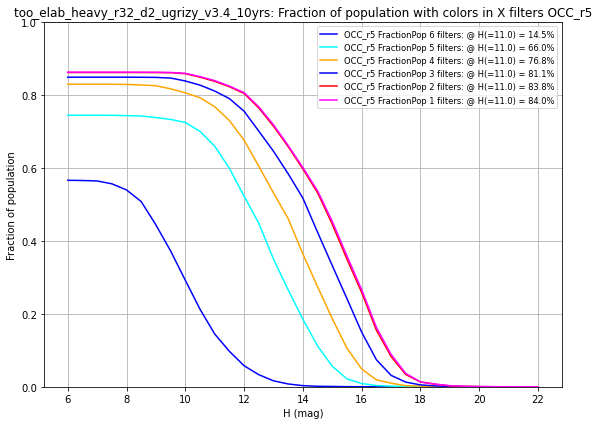
|
LightcurveColorOuter calculated on a MoObjSlicer basis.
Group: OCC_r5; Subgroup: Color/Inversion
| Group: OCC_r5; Subgroup: Color/Inversion; Slicer: MoObjSlicer | ||||||
| FractionPop 1 filters | FractionPop 2 filters | FractionPop 3 filters | FractionPop 4 filters | FractionPop 5 filters | FractionPop 6 filters | |
|---|---|---|---|---|---|---|
| OCC_r5 | 0.84 | 0.84 | 0.81 | 0.77 | 0.66 | 0.14 |
Group: OCC_r5; Subgroup: Completeness
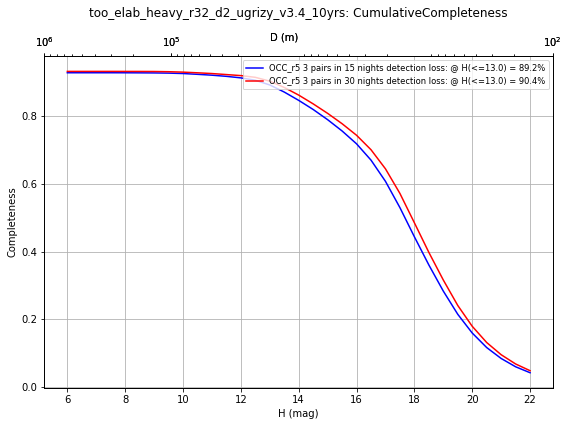
|
CumulativeCompleteness metric(s) calculated on a MoObjSlicer grid, for opsim runs too_elab_heavy_r32_d2_ugrizy_v3.4_10yrs, for info_label values of 15, 30 in detection 3 pairs OCC_r5 nights loss .
DifferentialCompleteness MoObjSlicer 15, 30 in detection 3 pairs OCC_r5 nights loss
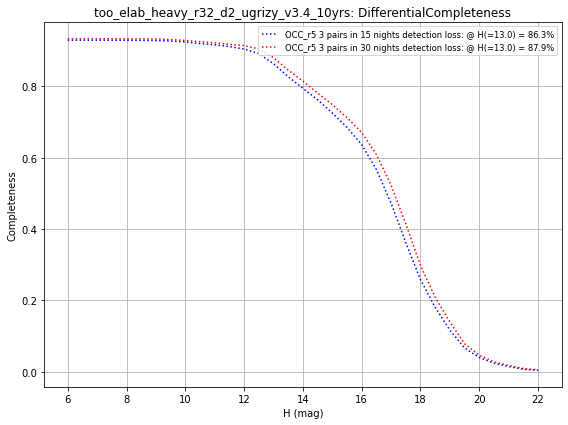
|
DifferentialCompleteness metric(s) calculated on a MoObjSlicer grid, for opsim runs too_elab_heavy_r32_d2_ugrizy_v3.4_10yrs, for info_label values of 15, 30 in detection 3 pairs OCC_r5 nights loss .
| Group: OCC_r5; Subgroup: Completeness; Slicer: MoObjSlicer | ||
| CumulativeCompleteness | DifferentialCompleteness | |
|---|---|---|
| OCC_r5 1 quad in 1 night detection loss | 0.89 | 0.86 |
| OCC_r5 3 pairs in 15 nights SNR=0 detection loss | 0.93 | 0.93 |
| OCC_r5 3 pairs in 15 nights SNR=3 detection loss | 0.91 | 0.89 |
| OCC_r5 3 pairs in 15 nights SNR=4 detection loss | 0.90 | 0.88 |
| OCC_r5 3 pairs in 15 nights SNR=5 detection loss | 0.89 | 0.86 |
| OCC_r5 3 pairs in 15 nights detection loss | 0.89 | 0.86 |
| OCC_r5 3 pairs in 15 nights trailing loss | 0.89 | 0.86 |
| OCC_r5 3 pairs in 30 nights detection loss | 0.90 | 0.88 |
| OCC_r5 3 pairs in 30 nights trailing loss | 0.90 | 0.88 |
| OCC_r5 3 triplets in 30 nights detection loss | 0.71 | 0.63 |
| OCC_r5 4 pairs in 20 nights detection loss | 0.87 | 0.83 |
| OCC_r5 6 detections in 60 nights detection loss | 0.92 | 0.91 |
| OCC_r5 High velocity pair detection loss | 0.04 | 0.04 |
| OCC_r5 Single detection detection loss | 0.93 | 0.92 |
| OCC_r5 Single pair detection loss | 0.93 | 0.92 |
Group: OCC_r5; Subgroup: Completeness Over Time
Group: OCC_r5; Subgroup: Completeness all criteria
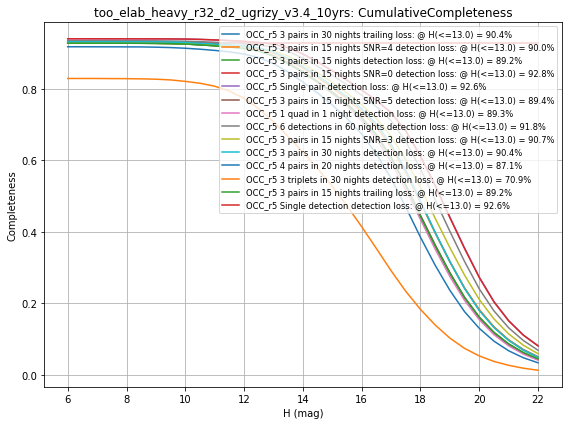
|
Plotting all of the cumulative completeness curves together.
Group: OCC_r5; Subgroup: Completeness over time
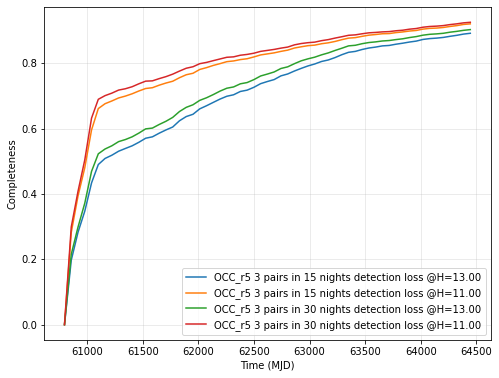
|
Completeness over time, for H values indicated in legend.
Group: OCC_r5; Subgroup: Discovery
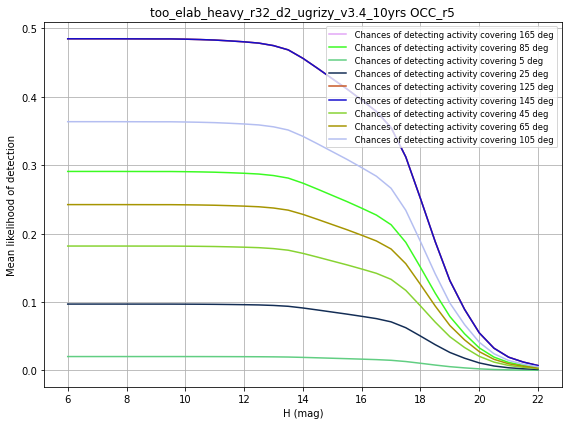
|
Discovery_2x3in15 calculated on a MoObjSlicer basis.
Chances of detecting activity lasting X days MoObjSlicer OCC_r5
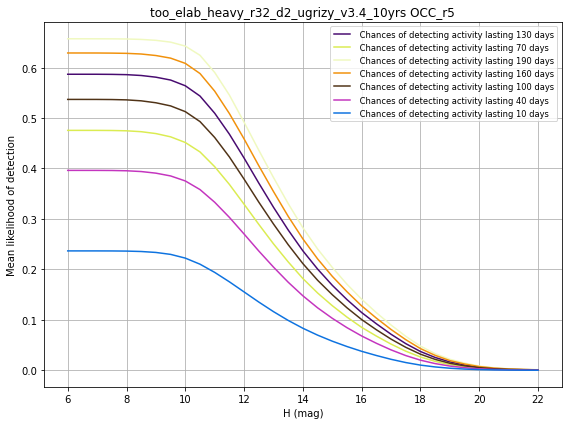
|
Discovery_2x3in15 calculated on a MoObjSlicer basis.
HighVelocityNights MoObjSlicer OCC_r5 High velocity pair detection loss
|
HighVelocityNights calculated on a MoObjSlicer basis.
MagicDiscovery MoObjSlicer OCC_r5 6 detections in 60 nights detection loss
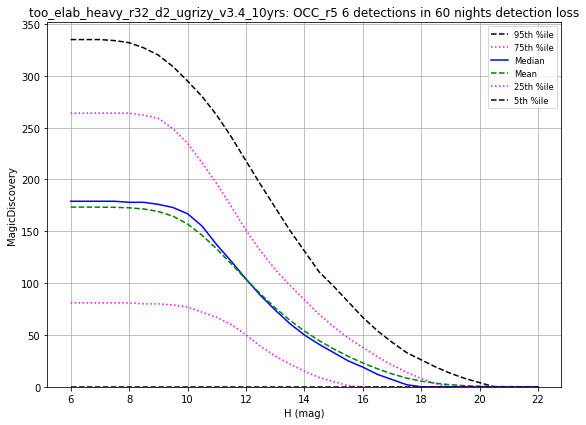
|
MagicDiscovery calculated on a MoObjSlicer basis.
Group: OCC_r5; Subgroup: N Chances
|
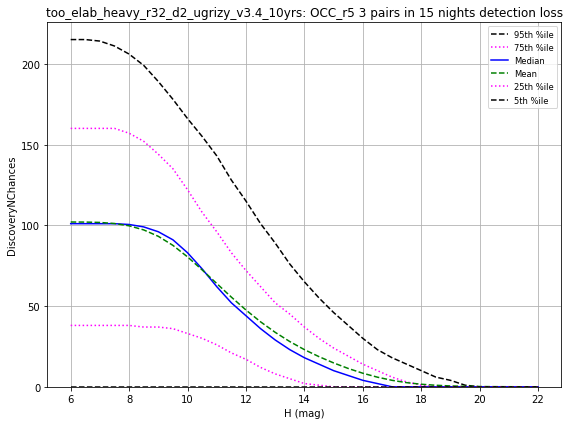
Number of chances for discovery of objects
Group: OCC_r5; Subgroup: N Obs
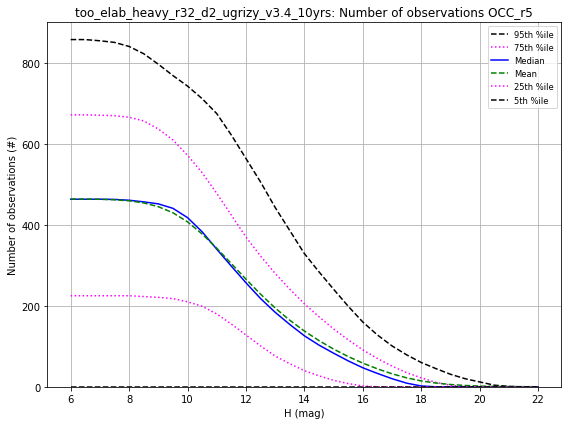
|
NObs calculated on a MoObjSlicer basis.
Group: OCC_r5; Subgroup: Obs Arc
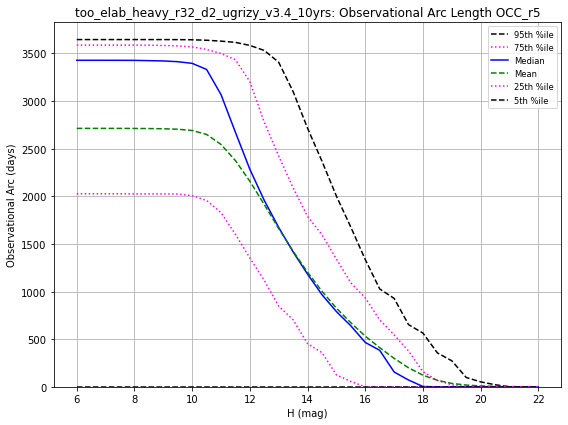
|
ObsArc calculated on a MoObjSlicer basis.
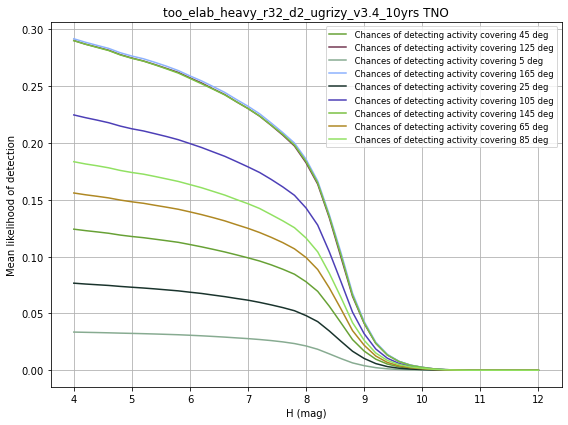
Group: PHA; Subgroup: Activity
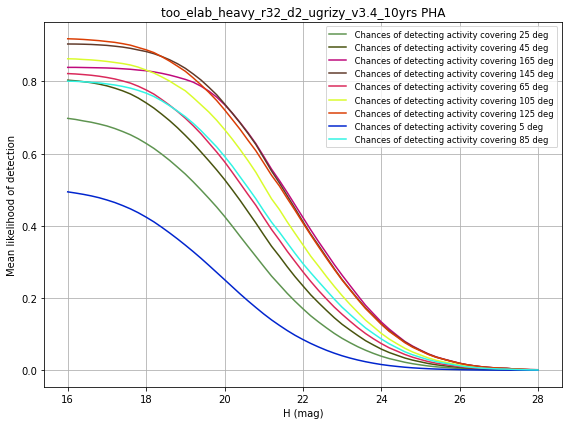
|
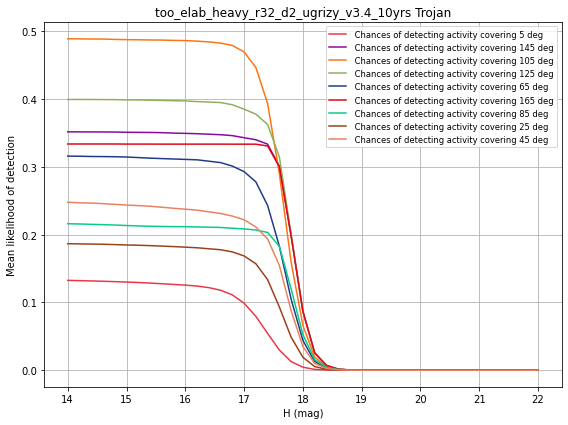
Chances of detecting activity covering 25 deg calculated on a MoObjSlicer basis.
Chances of detecting activity lasting X days MoObjSlicer PHA
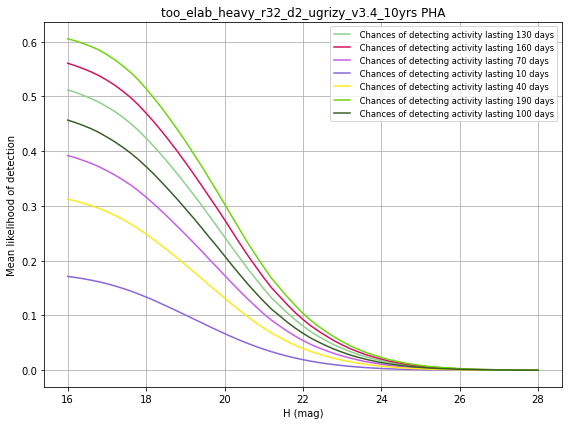
|
Chances of detecting activity covering 25 deg calculated on a MoObjSlicer basis.
Group: PHA; Subgroup: Characterization Fraction
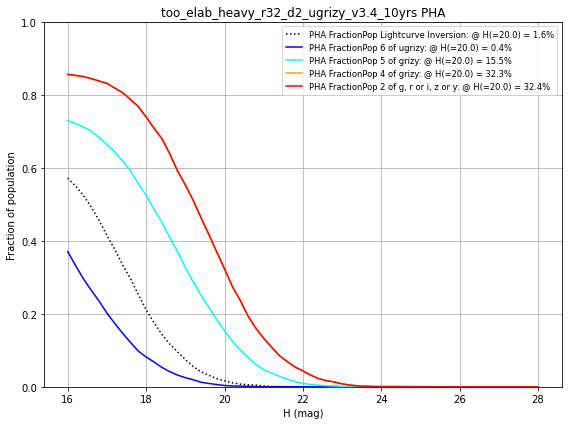
|
LightcurveInversionAsteroid calculated on a MoObjSlicer basis.
Group: PHA; Subgroup: Color/Inversion
| Group: PHA; Subgroup: Color/Inversion; Slicer: MoObjSlicer | |||||
| FractionPop 2 of g, r or i, z or y | FractionPop 4 of grizy | FractionPop 5 of grizy | FractionPop 6 of ugrizy | FractionPop Lightcurve Inversion | |
|---|---|---|---|---|---|
| PHA | 0.32 | 0.32 | 0.15 | 0.0036 | 0.0164 |
Group: PHA; Subgroup: Completeness
|
CumulativeCompleteness metric(s) calculated on a MoObjSlicer grid, for opsim runs too_elab_heavy_r32_d2_ugrizy_v3.4_10yrs, for info_label values of 15, 30 in loss 3 nights pairs detection PHA .
DifferentialCompleteness MoObjSlicer 15, 30 in loss 3 nights pairs detection PHA
|
DifferentialCompleteness metric(s) calculated on a MoObjSlicer grid, for opsim runs too_elab_heavy_r32_d2_ugrizy_v3.4_10yrs, for info_label values of 15, 30 in loss 3 nights pairs detection PHA .
| Group: PHA; Subgroup: Completeness; Slicer: MoObjSlicer | |||
| Metric Name | Info Label | Nobj <= 22.0 | Value At H=22.0 |
|---|---|---|---|
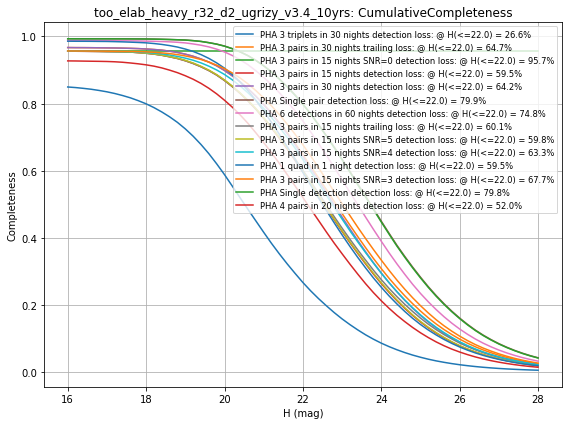
| CumulativeCompleteness | PHA 1 quad in 1 night detection loss | -- | 0.59 |
| DifferentialCompleteness | PHA 1 quad in 1 night detection loss | 2197.19 | 0.36 |
| CumulativeCompleteness | PHA 3 pairs in 15 nights SNR=0 detection loss | -- | 0.96 |
| DifferentialCompleteness | PHA 3 pairs in 15 nights SNR=0 detection loss | 3501.46 | 0.96 |
| CumulativeCompleteness | PHA 3 pairs in 15 nights SNR=3 detection loss | -- | 0.68 |
| DifferentialCompleteness | PHA 3 pairs in 15 nights SNR=3 detection loss | 2490.50 | 0.49 |
| CumulativeCompleteness | PHA 3 pairs in 15 nights SNR=4 detection loss | -- | 0.63 |
| DifferentialCompleteness | PHA 3 pairs in 15 nights SNR=4 detection loss | 2332.59 | 0.43 |
| CumulativeCompleteness | PHA 3 pairs in 15 nights SNR=5 detection loss | -- | 0.60 |
| DifferentialCompleteness | PHA 3 pairs in 15 nights SNR=5 detection loss | 2204.59 | 0.38 |
| CumulativeCompleteness | PHA 3 pairs in 15 nights detection loss | -- | 0.60 |
| DifferentialCompleteness | PHA 3 pairs in 15 nights detection loss | 2196.01 | 0.38 |
| CumulativeCompleteness | PHA 3 pairs in 15 nights trailing loss | -- | 0.60 |
| DifferentialCompleteness | PHA 3 pairs in 15 nights trailing loss | 2216.74 | 0.39 |
| CumulativeCompleteness | PHA 3 pairs in 30 nights detection loss | -- | 0.64 |
| DifferentialCompleteness | PHA 3 pairs in 30 nights detection loss | 2365.62 | 0.43 |
| CumulativeCompleteness | PHA 3 pairs in 30 nights trailing loss | -- | 0.65 |
| DifferentialCompleteness | PHA 3 pairs in 30 nights trailing loss | 2384.83 | 0.44 |
| CumulativeCompleteness | PHA 3 triplets in 30 nights detection loss | -- | 0.27 |
| DifferentialCompleteness | PHA 3 triplets in 30 nights detection loss | 1001.74 | 0.10 |
| CumulativeCompleteness | PHA 4 pairs in 20 nights detection loss | -- | 0.52 |
| DifferentialCompleteness | PHA 4 pairs in 20 nights detection loss | 1921.91 | 0.31 |
| CumulativeCompleteness | PHA 6 detections in 60 nights detection loss | -- | 0.75 |
| DifferentialCompleteness | PHA 6 detections in 60 nights detection loss | 2748.07 | 0.57 |
| CumulativeCompleteness | PHA High velocity pair detection loss | -- | 0.35 |
| DifferentialCompleteness | PHA High velocity pair detection loss | 1272.71 | 0.30 |
| CumulativeCompleteness | PHA Single detection detection loss | -- | 0.80 |
| DifferentialCompleteness | PHA Single detection detection loss | 2927.89 | 0.63 |
| CumulativeCompleteness | PHA Single pair detection loss | -- | 0.80 |
| DifferentialCompleteness | PHA Single pair detection loss | 2931.23 | 0.64 |
Group: PHA; Subgroup: Completeness Over Time
Group: PHA; Subgroup: Completeness all criteria
|
Plotting all of the cumulative completeness curves together.
Group: PHA; Subgroup: Completeness over time
|
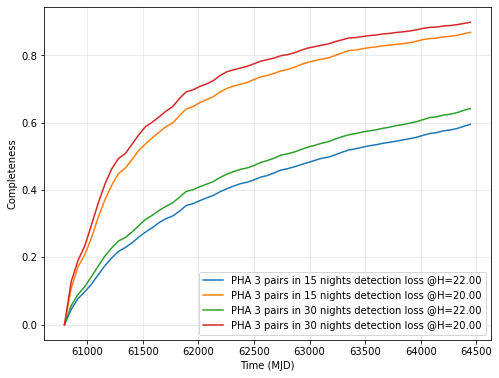
Completeness over time, for H values indicated in legend.
Group: PHA; Subgroup: Discovery
|
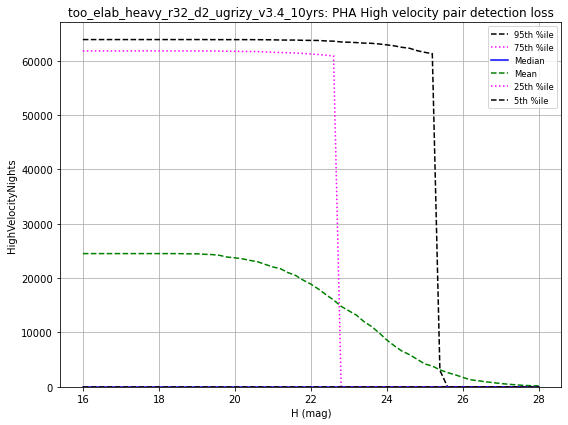
HighVelocityNights calculated on a MoObjSlicer basis.
MagicDiscovery MoObjSlicer PHA 6 detections in 60 nights detection loss
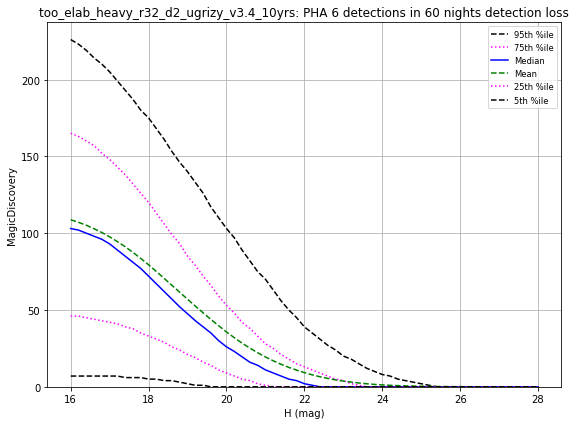
|
MagicDiscovery calculated on a MoObjSlicer basis.
Group: PHA; Subgroup: N Chances

|
Number of chances for discovery of objects
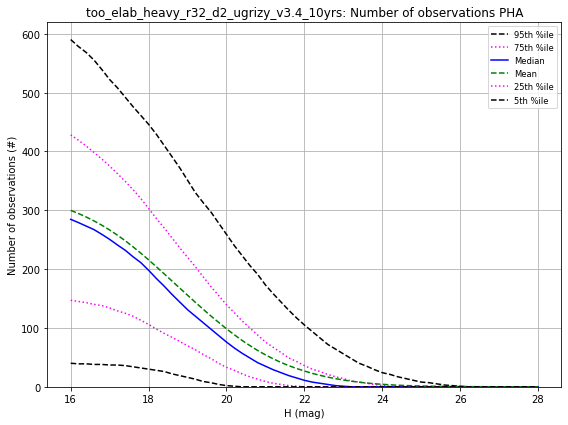
|
NObs calculated on a MoObjSlicer basis.
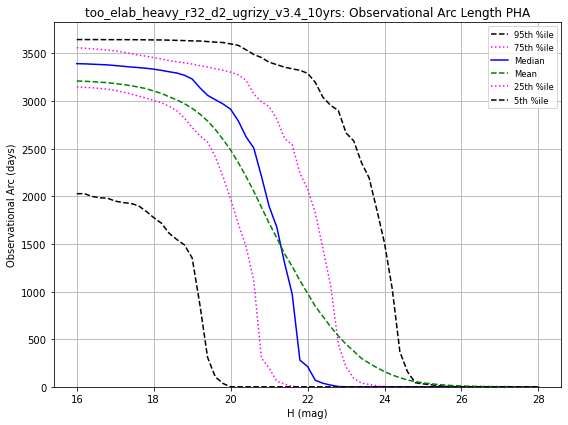
|
ObsArc calculated on a MoObjSlicer basis.
Group: TNO; Subgroup: Activity
Group: TNO; Subgroup: Characterization Fraction
|
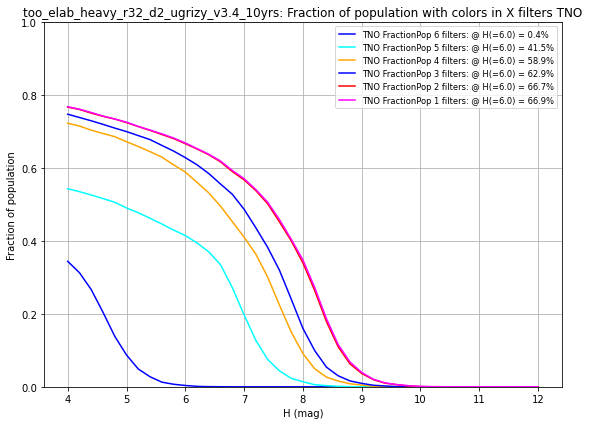
LightcurveColorOuter calculated on a MoObjSlicer basis.
Group: TNO; Subgroup: Color/Inversion
| Group: TNO; Subgroup: Color/Inversion; Slicer: MoObjSlicer | ||||||
| FractionPop 1 filters | FractionPop 2 filters | FractionPop 3 filters | FractionPop 4 filters | FractionPop 5 filters | FractionPop 6 filters | |
|---|---|---|---|---|---|---|
| TNO | 0.67 | 0.67 | 0.63 | 0.59 | 0.41 | 0.0036 |
Group: TNO; Subgroup: Completeness
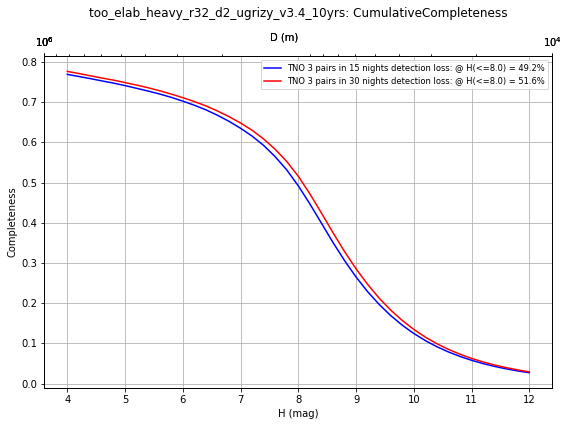
|
CumulativeCompleteness metric(s) calculated on a MoObjSlicer grid, for opsim runs too_elab_heavy_r32_d2_ugrizy_v3.4_10yrs, for info_label values of 15, 30 in loss 3 detection TNO pairs nights .
DifferentialCompleteness MoObjSlicer 15, 30 in loss 3 detection TNO pairs nights
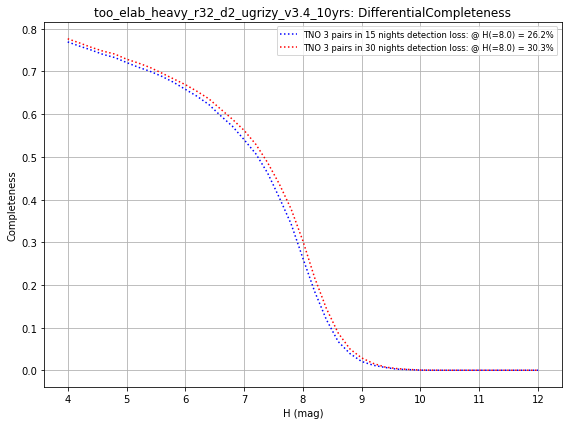
|
DifferentialCompleteness metric(s) calculated on a MoObjSlicer grid, for opsim runs too_elab_heavy_r32_d2_ugrizy_v3.4_10yrs, for info_label values of 15, 30 in loss 3 detection TNO pairs nights .
| Group: TNO; Subgroup: Completeness; Slicer: MoObjSlicer | ||
| CumulativeCompleteness | DifferentialCompleteness | |
|---|---|---|
| TNO 1 quad in 1 night detection loss | 0.53 | 0.33 |
| TNO 3 pairs in 15 nights SNR=0 detection loss | 0.91 | 0.91 |
| TNO 3 pairs in 15 nights SNR=3 detection loss | 0.58 | 0.42 |
| TNO 3 pairs in 15 nights SNR=4 detection loss | 0.53 | 0.34 |
| TNO 3 pairs in 15 nights SNR=5 detection loss | 0.49 | 0.26 |
| TNO 3 pairs in 15 nights detection loss | 0.49 | 0.26 |
| TNO 3 pairs in 15 nights trailing loss | 0.49 | 0.26 |
| TNO 3 pairs in 30 nights detection loss | 0.52 | 0.30 |
| TNO 3 pairs in 30 nights trailing loss | 0.52 | 0.30 |
| TNO 3 triplets in 30 nights detection loss | 0.32 | 0.12 |
| TNO 4 pairs in 20 nights detection loss | 0.44 | 0.20 |
| TNO 6 detections in 60 nights detection loss | 0.58 | 0.42 |
| TNO High velocity pair detection loss | 0.0000 | 0.0000 |
| TNO Single detection detection loss | 0.60 | 0.47 |
| TNO Single pair detection loss | 0.60 | 0.47 |
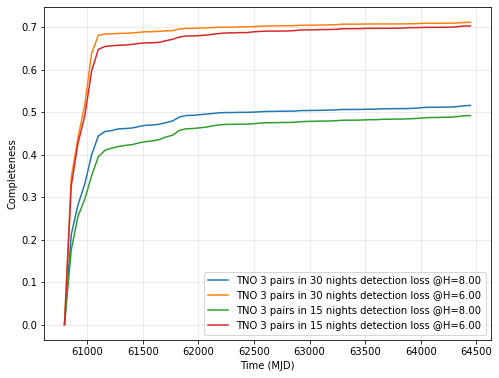
Group: TNO; Subgroup: Completeness Over Time
Group: TNO; Subgroup: Completeness all criteria
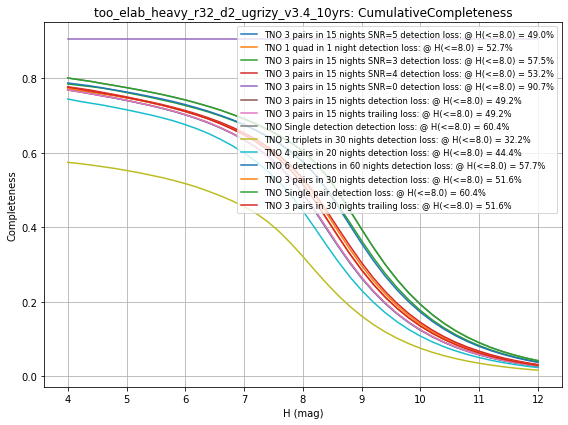
|
Plotting all of the cumulative completeness curves together.
Group: TNO; Subgroup: Completeness over time
|
Completeness over time, for H values indicated in legend.
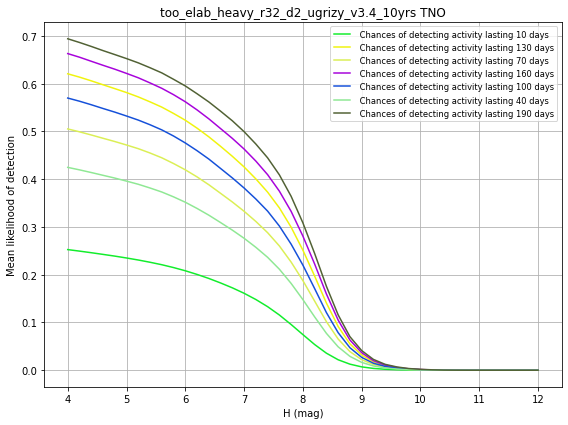
Group: TNO; Subgroup: Discovery
|
Discovery_2x3in30 calculated on a MoObjSlicer basis.
Chances of detecting activity lasting X days MoObjSlicer TNO
|
Discovery_2x3in30 calculated on a MoObjSlicer basis.
HighVelocityNights MoObjSlicer TNO High velocity pair detection loss

|
HighVelocityNights calculated on a MoObjSlicer basis.
MagicDiscovery MoObjSlicer TNO 6 detections in 60 nights detection loss
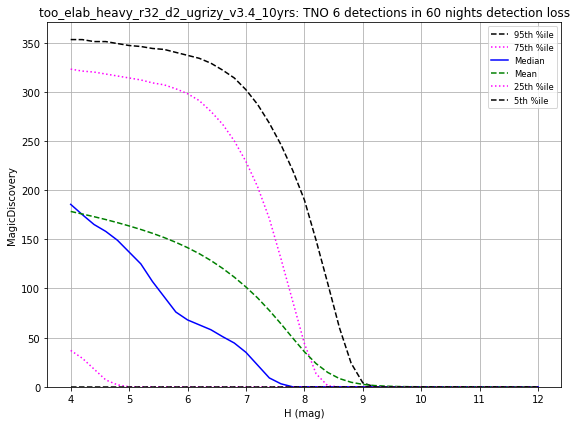
|
MagicDiscovery calculated on a MoObjSlicer basis.
Group: TNO; Subgroup: N Chances
|
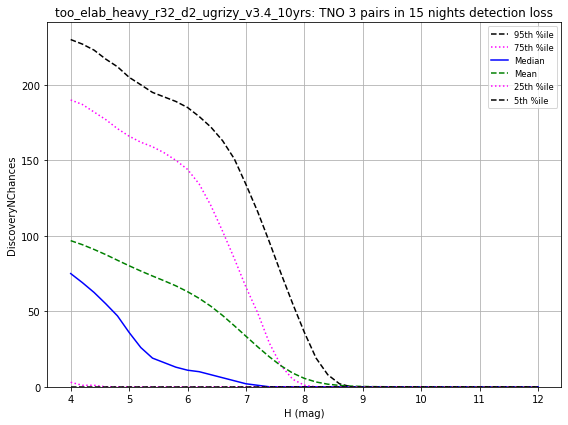
Number of chances for discovery of objects

|
NObs calculated on a MoObjSlicer basis.
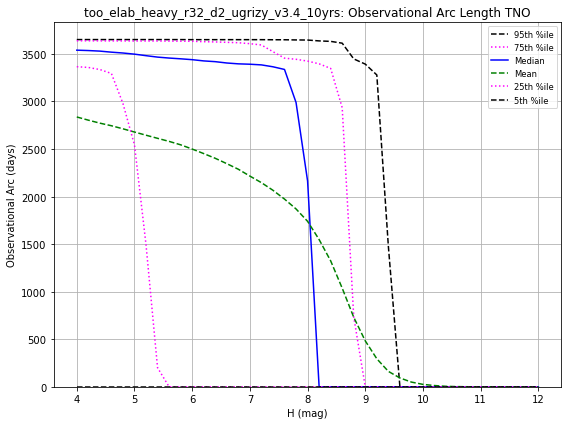
|
ObsArc calculated on a MoObjSlicer basis.
Group: Trojan; Subgroup: Activity
Group: Trojan; Subgroup: Characterization Fraction
|
LightcurveInversionAsteroid calculated on a MoObjSlicer basis.
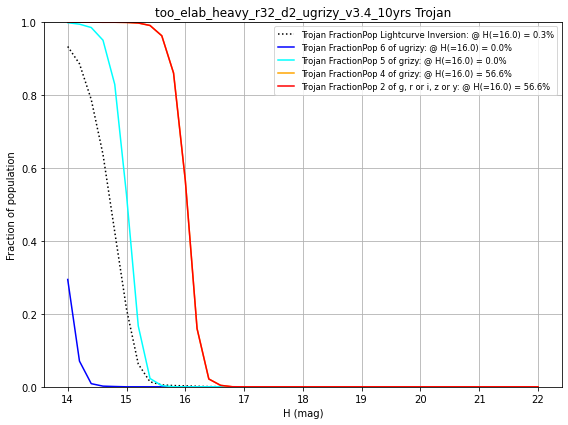
Group: Trojan; Subgroup: Color/Inversion
| Group: Trojan; Subgroup: Color/Inversion; Slicer: MoObjSlicer | |||||
| FractionPop 2 of g, r or i, z or y | FractionPop 4 of grizy | FractionPop 5 of grizy | FractionPop 6 of ugrizy | FractionPop Lightcurve Inversion | |
|---|---|---|---|---|---|
| Trojan | 0.57 | 0.57 | 0.0000 | 0.0000 | 0.0026 |
Group: Trojan; Subgroup: Completeness
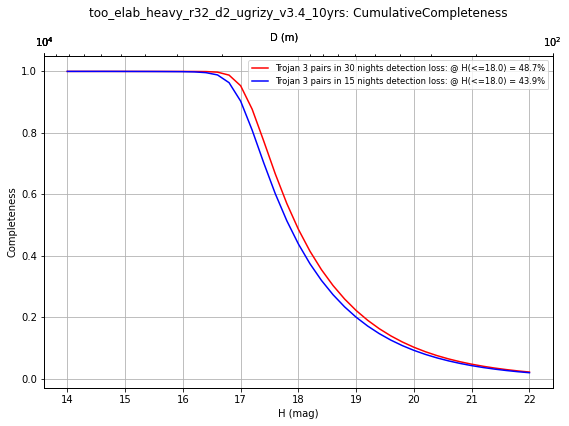
|
CumulativeCompleteness metric(s) calculated on a MoObjSlicer grid, for opsim runs too_elab_heavy_r32_d2_ugrizy_v3.4_10yrs, for info_label values of 30, 15 nights pairs loss detection in Trojan 3 .
DifferentialCompleteness MoObjSlicer 30, 15 nights pairs loss detection in Trojan 3
|
DifferentialCompleteness metric(s) calculated on a MoObjSlicer grid, for opsim runs too_elab_heavy_r32_d2_ugrizy_v3.4_10yrs, for info_label values of 30, 15 nights pairs loss detection in Trojan 3 .
| Group: Trojan; Subgroup: Completeness; Slicer: MoObjSlicer | ||
| CumulativeCompleteness | DifferentialCompleteness | |
|---|---|---|
| Trojan 1 quad in 1 night detection loss | 0.47 | 0.0070 |
| Trojan 3 pairs in 15 nights SNR=0 detection loss | 1.00 | 1.00 |
| Trojan 3 pairs in 15 nights SNR=3 detection loss | 0.64 | 0.04 |
| Trojan 3 pairs in 15 nights SNR=4 detection loss | 0.52 | 0.0056 |
| Trojan 3 pairs in 15 nights SNR=5 detection loss | 0.44 | 0.0006 |
| Trojan 3 pairs in 15 nights detection loss | 0.44 | 0.0014 |
| Trojan 3 pairs in 15 nights trailing loss | 0.44 | 0.0010 |
| Trojan 3 pairs in 30 nights detection loss | 0.49 | 0.0014 |
| Trojan 3 pairs in 30 nights trailing loss | 0.49 | 0.0010 |
| Trojan 3 triplets in 30 nights detection loss | 0.23 | 0.0000 |
| Trojan 4 pairs in 20 nights detection loss | 0.37 | 0.0000 |
| Trojan 6 detections in 60 nights detection loss | 0.64 | 0.03 |
| Trojan High velocity pair detection loss | 0.0000 | 0.0000 |
| Trojan Single detection detection loss | 0.71 | 0.10 |
| Trojan Single pair detection loss | 0.72 | 0.10 |
Group: Trojan; Subgroup: Completeness Over Time
|
Time of discovery of objects
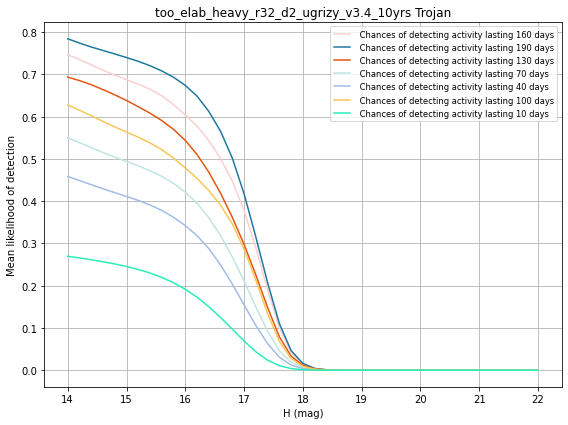
Chances of detecting activity lasting X days MoObjSlicer Trojan
|
Time of discovery of objects
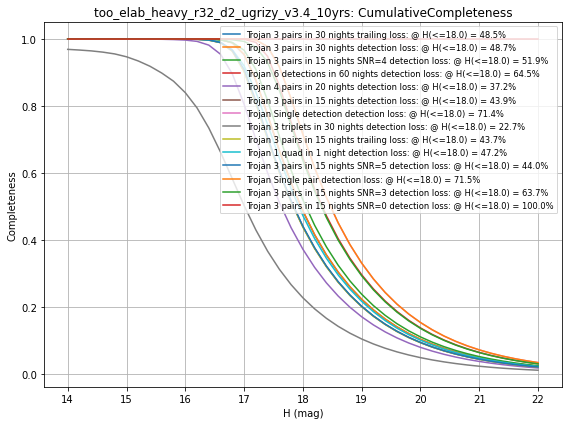
Group: Trojan; Subgroup: Completeness all criteria
|
Plotting all of the cumulative completeness curves together.
Group: Trojan; Subgroup: Completeness over time
|
Completeness over time, for H values indicated in legend.
Group: Trojan; Subgroup: Discovery

|
HighVelocityNights calculated on a MoObjSlicer basis.
MagicDiscovery MoObjSlicer Trojan 6 detections in 60 nights detection loss
|
MagicDiscovery calculated on a MoObjSlicer basis.
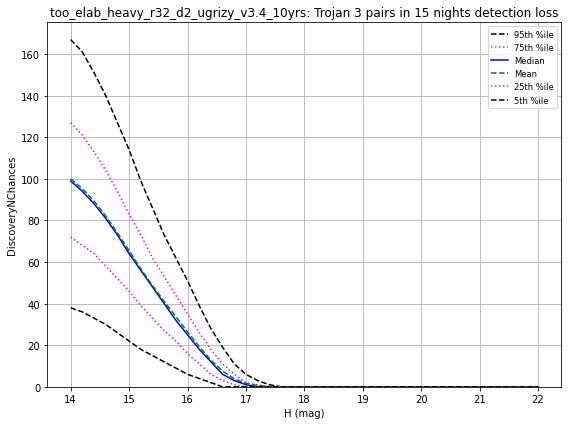
Group: Trojan; Subgroup: N Chances
|
Number of chances for discovery of objects
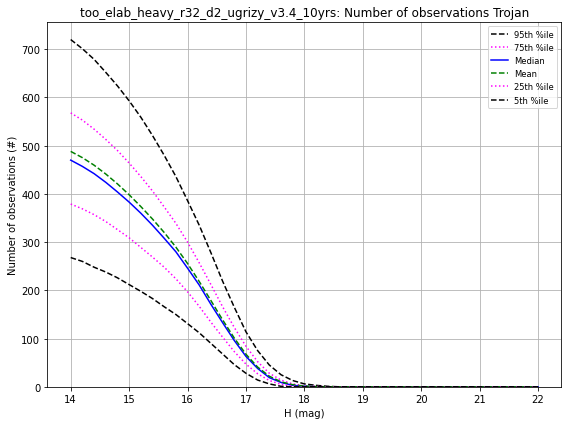
Group: Trojan; Subgroup: N Obs
|
NObs calculated on a MoObjSlicer basis.
Group: Trojan; Subgroup: Obs Arc
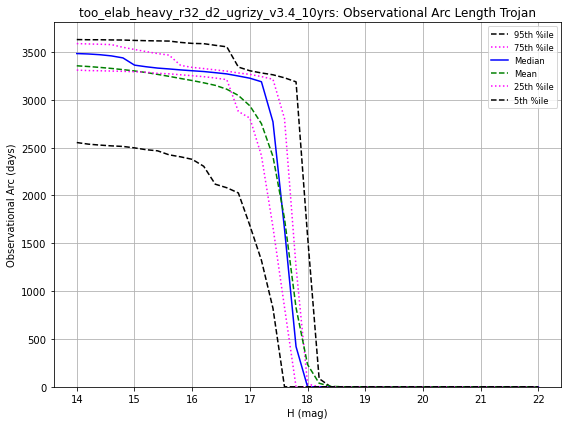
|
ObsArc calculated on a MoObjSlicer basis.
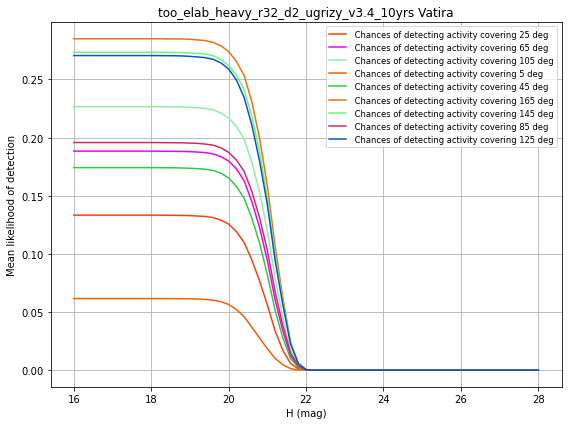
Group: Vatira; Subgroup: Activity
Group: Vatira; Subgroup: Characterization Fraction
|
ColorAsteroid calculated on a MoObjSlicer basis.
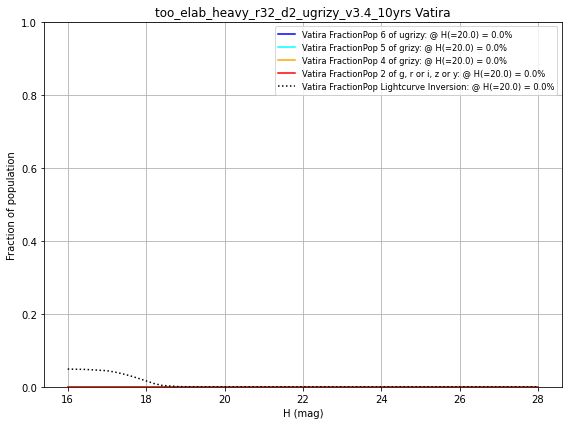
Group: Vatira; Subgroup: Color/Inversion
| Group: Vatira; Subgroup: Color/Inversion; Slicer: MoObjSlicer | |||||
| FractionPop 2 of g, r or i, z or y | FractionPop 4 of grizy | FractionPop 5 of grizy | FractionPop 6 of ugrizy | FractionPop Lightcurve Inversion | |
|---|---|---|---|---|---|
| Vatira | 0.0000 | 0.0000 | 0.0000 | 0.0000 | 0.0000 |
Group: Vatira; Subgroup: Completeness
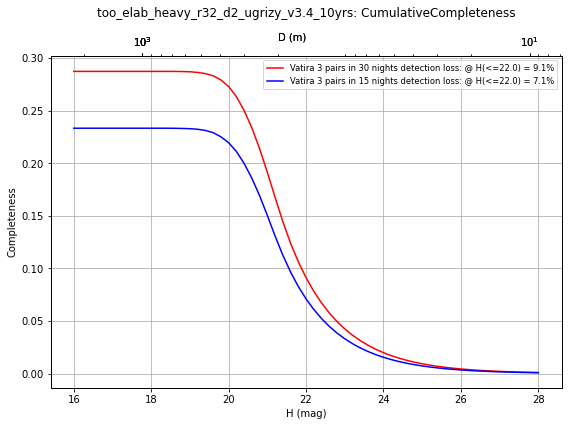
|
CumulativeCompleteness metric(s) calculated on a MoObjSlicer grid, for opsim runs too_elab_heavy_r32_d2_ugrizy_v3.4_10yrs, for info_label values of 30, 15 loss pairs detection in nights Vatira 3 .
DifferentialCompleteness MoObjSlicer 30, 15 loss pairs detection in nights Vatira 3
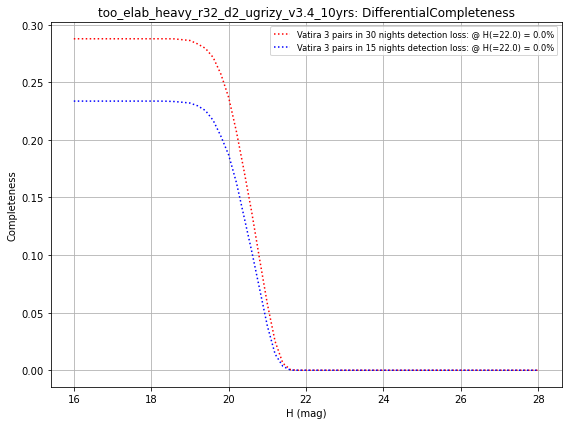
|
DifferentialCompleteness metric(s) calculated on a MoObjSlicer grid, for opsim runs too_elab_heavy_r32_d2_ugrizy_v3.4_10yrs, for info_label values of 30, 15 loss pairs detection in nights Vatira 3 .
| Group: Vatira; Subgroup: Completeness; Slicer: MoObjSlicer | ||
| CumulativeCompleteness | DifferentialCompleteness | |
|---|---|---|
| Vatira 1 quad in 1 night detection loss | 0.18 | 0.0001 |
| Vatira 3 pairs in 15 nights SNR=0 detection loss | 0.23 | 0.23 |
| Vatira 3 pairs in 15 nights SNR=3 detection loss | 0.10 | 0.0004 |
| Vatira 3 pairs in 15 nights SNR=4 detection loss | 0.08 | 0.0000 |
| Vatira 3 pairs in 15 nights SNR=5 detection loss | 0.07 | 0.0000 |
| Vatira 3 pairs in 15 nights detection loss | 0.07 | 0.0000 |
| Vatira 3 pairs in 15 nights trailing loss | 0.07 | 0.0000 |
| Vatira 3 pairs in 30 nights detection loss | 0.09 | 0.0000 |
| Vatira 3 pairs in 30 nights trailing loss | 0.09 | 0.0000 |
| Vatira 3 triplets in 30 nights detection loss | 0.09 | 0.0000 |
| Vatira 4 pairs in 20 nights detection loss | 0.05 | 0.0000 |
| Vatira 6 detections in 60 nights detection loss | 0.16 | 0.0000 |
| Vatira High velocity pair detection loss | 0.0000 | 0.0000 |
| Vatira Single detection detection loss | 0.22 | 0.0014 |
| Vatira Single pair detection loss | 0.22 | 0.0014 |
Group: Vatira; Subgroup: Completeness Over Time
Group: Vatira; Subgroup: Completeness all criteria
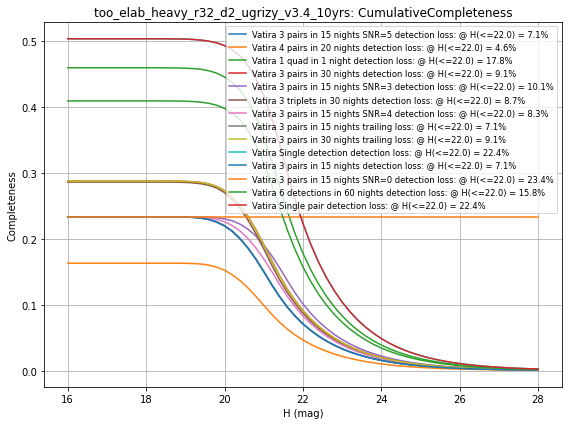
|
Plotting all of the cumulative completeness curves together.
Group: Vatira; Subgroup: Completeness over time
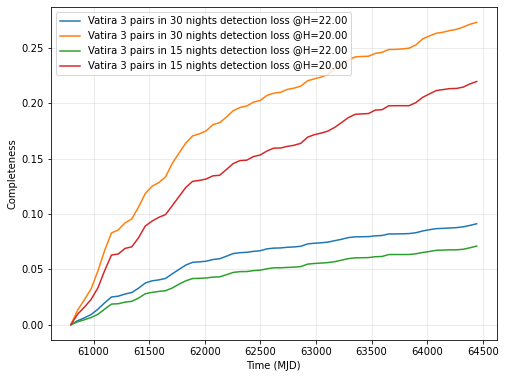
|
Completeness over time, for H values indicated in legend.
Group: Vatira; Subgroup: Discovery
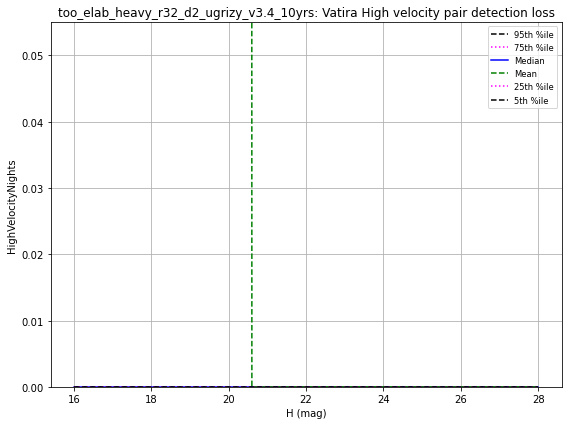
|
HighVelocityNights calculated on a MoObjSlicer basis.
MagicDiscovery MoObjSlicer Vatira 6 detections in 60 nights detection loss
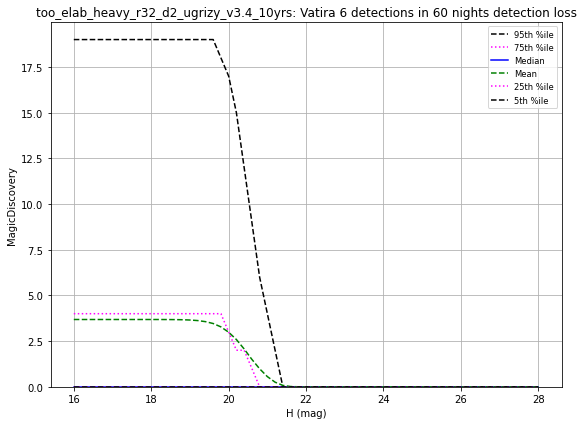
|
MagicDiscovery calculated on a MoObjSlicer basis.
Group: Vatira; Subgroup: N Chances
|
Number of chances for discovery of objects
Chances of detecting activity lasting X days MoObjSlicer Vatira
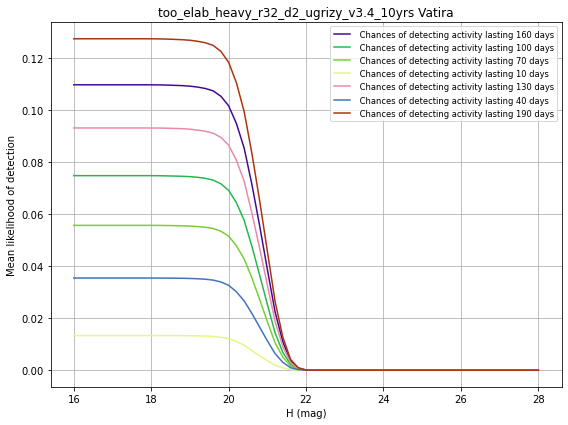
|
Number of chances for discovery of objects
DiscoveryNChances MoObjSlicer Vatira 3 pairs in 15 nights detection loss
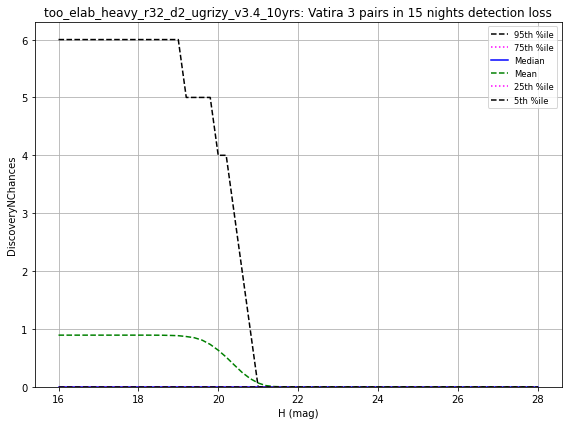
|
Number of chances for discovery of objects
Group: Vatira; Subgroup: N Obs
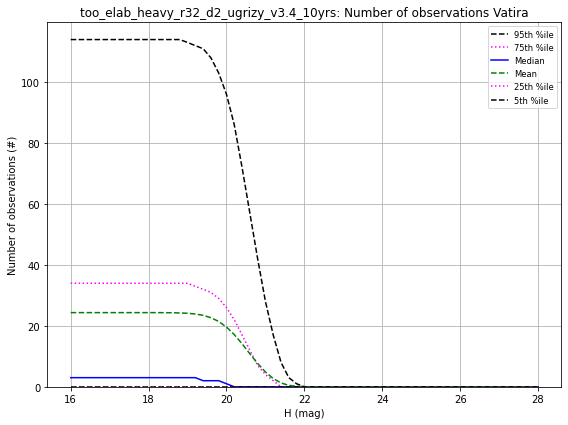
|
NObs calculated on a MoObjSlicer basis.
Group: Vatira; Subgroup: Obs Arc
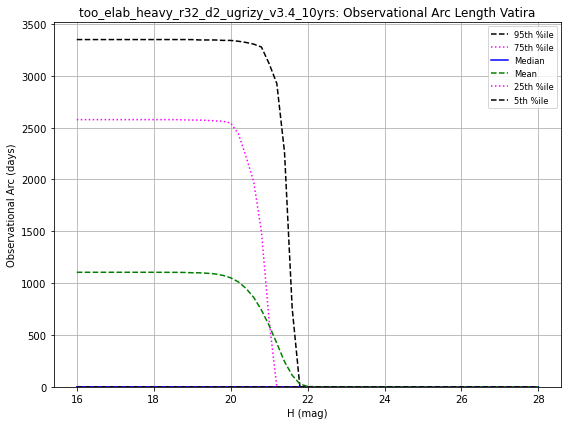
|
ObsArc calculated on a MoObjSlicer basis.